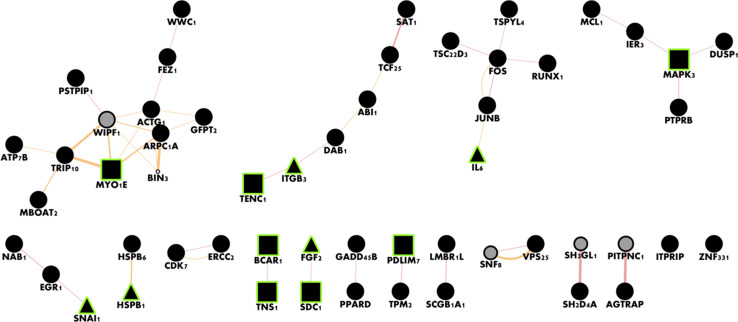
Fig. 5.
GeneMANIA analysis of overexpressed genes in the microarray reveals active connected components. Black nodes denote differentially expressed genes and lines denote physical interactions. Gray nodes were added by the GeneMANIA analysis. Rectangular nodes are related to adherens junction (q = 0.0041), and triangular nodes are related to positive regulation of cell migration (q = 0.013). This network analysis reveals tissue-specific effects, while also serving as a sanity check on the fibroblast microarray experiment

