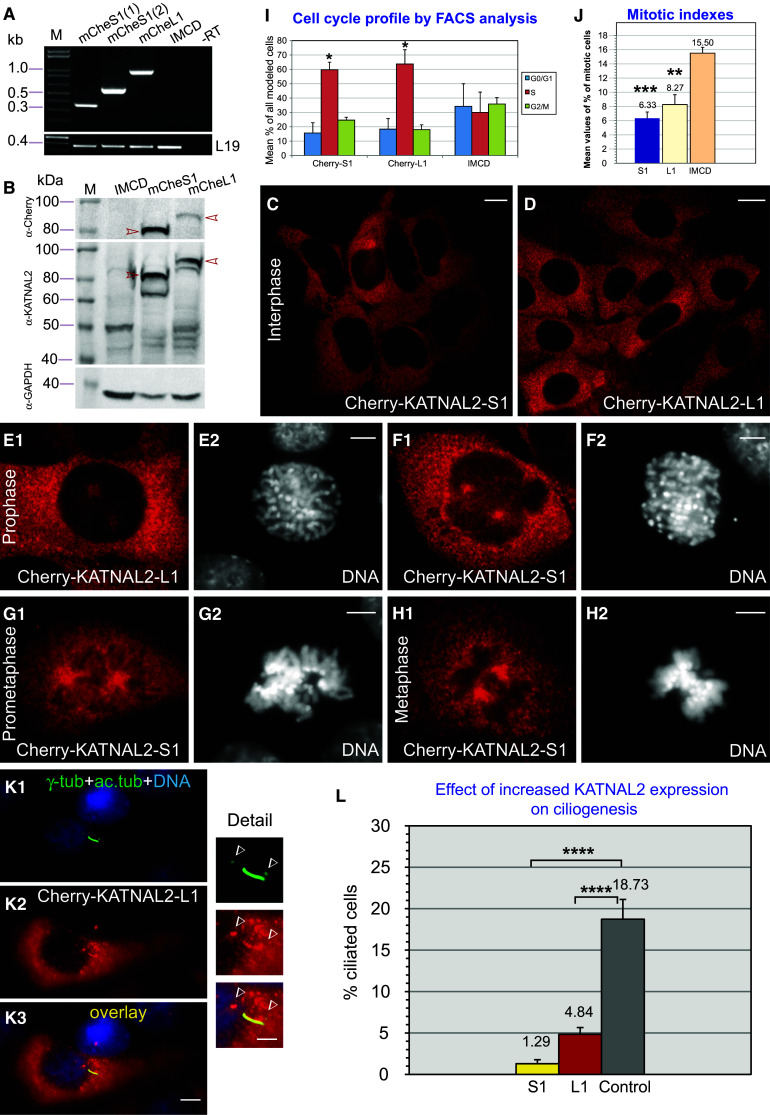
Fig. 7.

Generation and characterization of stable cell lines expressing Cherry-KATNAL2-S1 or -L1: increased expression of KATNAL2 decreases the percentage of ciliated cells. a Confirmation by RT-PCR of the integration of mCherry-KATNAL2 constructs into the genome of IMCD cells in each case (top panel), and equivalent reactions for L19 as internal normalizing control (bottom panel). Forward oligos to mCherry and reverse oligos either to mCherry (lane 1) or an internal Katnal2 sequence (lanes 2–5), were used to generate specific diagnostic products (oligo sequences in Table S1). From left to right: stable cell line IMCD-pmCherry-KATNAL2-S1 (lanes 1 and 2), IMCD-pmCherry-KATNAL2-L1 (lane 3), IMCD wild type (neg. control 1; lane 4), IMCD-pmCherry-KATNAL2-S1 minus RT (neg. control 2; lane 5). M size markers in kb. b Confirmation by WB of expression of mCherry-KATNAL2 fusion proteins, using anti-mCherry (top panel), anti-KATNAL2 (middle panel), and anti-GAPDH antibody as loading control (bottom panel). From left to right: IMCD wild type (neg. control; lane 1), stable cell line IMCD-pmCherry-KATNAL2-S1 (lane 2) and IMCD-pmCherry-KATNAL2-L1 (lane 3). In lanes 3 and 4, bands consistent with the appropriate size for Cherry-fusion proteins KATNAL2-S1 and -L1 are detected (red arrowheads), with expression levels comparable to the native KATNALs (all lanes). c–k Series of examples to show correct localization of mCherry-KATNAL2-S1 or -L1 at interphase (c, d), mitosis (prophase in e1, e2 and f1, f2; prometaphase in g1, g2 and metaphase in h1, h2) and at the primary cilium (k1–k3 and magnified images of cilium in the detail). mCherry labeling in red, acetylated tubulin in green and DNA in blue. Scale bars 5 μm; panels c, d 10 μm; detail of k1–k3 series 2.5 μm. i Flow cytometry analysis of the cell cycle profile of the three cell lines (IMCD and mCherry-KATNAL2-S1 or -L1) reveals a significant difference in the overall proportion of cells in different cell cycle phases (G1/0, S and G2/M) in the populations expressing KATNAL2 fusions, and, in particular, a significant increase of cells in the S phase for both -S1 and -L1 cells. j Reduction of the mitotic index of the Cherry-fusion KATNALs, compared to the control line. Values shown are the means of three independent experiments ± SD. Sample size corresponded to “dataset 5” (“Materials and methods”). l Quantification of the percentage of ciliated cells in populations of mCherry-KATNAL2-S1 (“S1”), and -L1 (“L1”), compared with corresponding control IMCD cells (“Control”). Shown are the average percentages from three independent experiments ± SD values. Sample size corresponded to “dataset 6” (“Materials and methods”)
