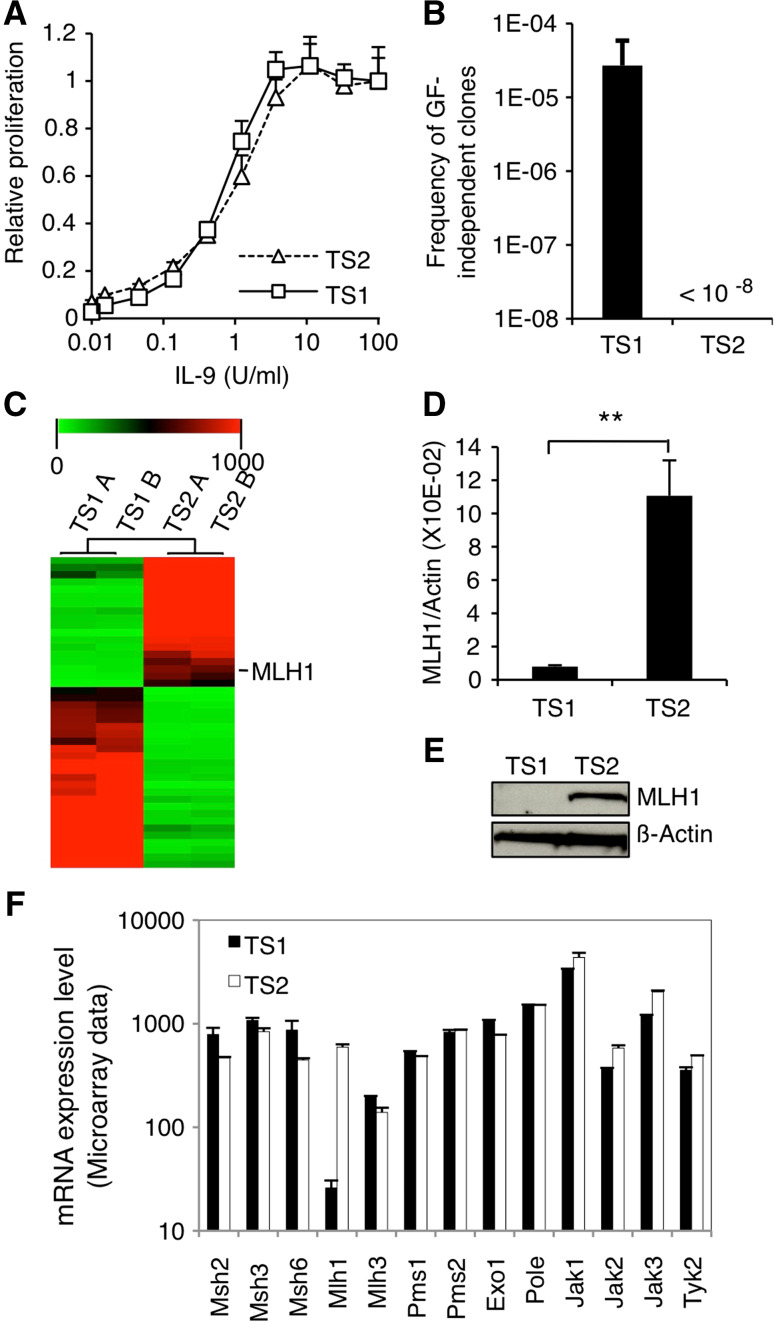
Fig. 1.
MLH1 expression is lost in TS1 cells. a TS1 and TS2 cells were seeded in 96-well plates at a density of 1000 cells/well in the presence of increasing concentrations of murine IL-9. After 48 h of culture, methyl-H3 thymidine was added to the cells for 4 h and thymidine incorporation was measured. Thymidine incorporation values were standardized relative to the value in the presence of IL-9 100 U/ml. b TS1 and TS2 cells were plated in the absence of IL-9 on 96-well plates at different densities ranging from 200 to 40,000 cells/well. 1–2 weeks later, wells positive for proliferation were visually screened. For TS1 cells, histogram represents mean ± SEM of seven independent selection experiments. Concerning TS2 cells, no GF-independent clones arose from a total of 108 tested cells. c Microarray data are represented as hierarchical clustering of transcripts ×20 differentially expressed in TS1 versus TS2 corresponding to a list of 44 genes (biological duplicates). The image was obtained with the Multiple Experiment Viewer program (MeV). The line corresponding to MLH1 transcript is indicated. d MLH1 mRNA levels were assessed by quantitative RT-PCR in TS1 and TS2 cells. Histograms represent mean ± SD of biological triplicates. Student’s t test was performed to determine p value. e MLH1 protein levels were assessed by western blot in TS1 and TS2 cells. The membrane was probed with anti-β-actin antibody as loading control. f mRNA expression levels of the different components of the MMR system and JAK kinases in TS1 and TS2 cell lines based on the microarray transcriptome analysis. Histograms represent mean ± SD of biological duplicates

