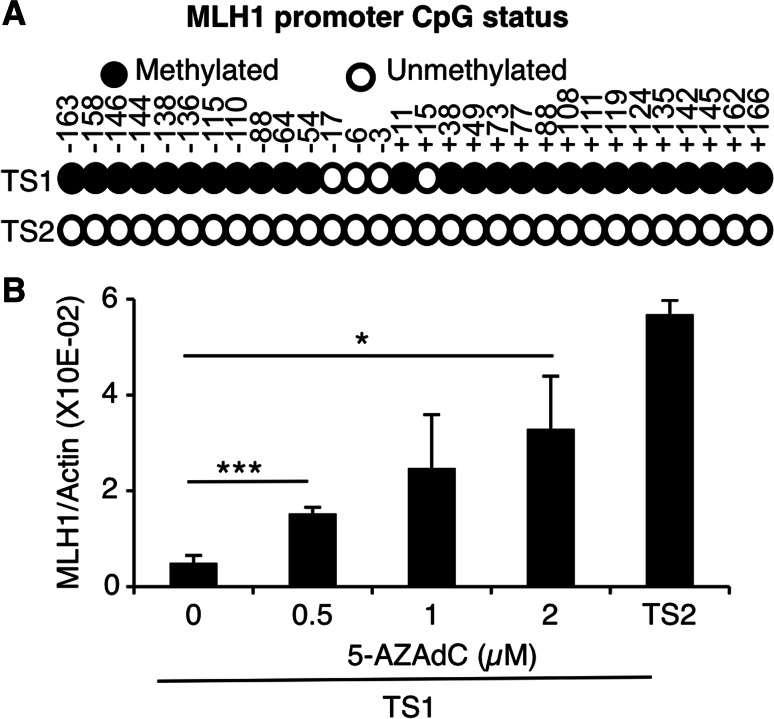
Fig. 2.
MLH1 expression is repressed by promoter methylation in TS1 cells. a Methylation status of the MLH1 promoter was determined by bisulfite sequencing of genomic DNA in TS1 and TS2 cells. Circles represent CpG sites (methylated in black, unmethylated in white). Data represent sequencing results of seven clones from the PCR product for each cell line. Numbers indicate the nucleotide position relative to the origin of transcription. b MLH1 mRNA levels were assessed by quantitative RT-PCR in TS1 cells treated with 0/0.5/1/2 µM of 5-AZA-2′deoxycytidine for 48 h. Histograms represent mean ± SEM of three independent experiments. One-way ANOVA test was performed to determine p values (*p < 0.05, ***p < 0.001)

