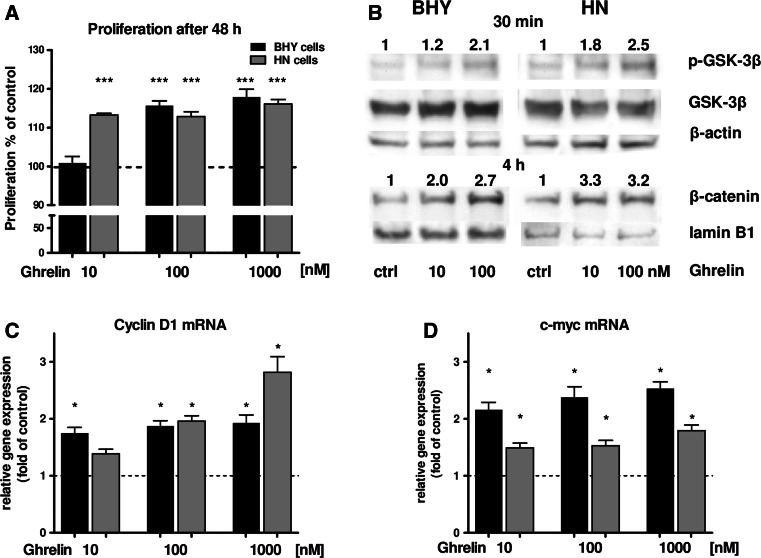
Fig. 2.
a Proliferation rates of BHY and HN cells after stimulation with ghrelin. b Western Blot of GSK-3β and phospho-GSK-3β (p-GSK-3β) in BHY and HN cells after ghrelin treatment. β-actin served as cytosolic loading control for comparison. For densitometric analysis, band intensities of p-GSK-3β and GSK-3β were normalized to β-actin. The numbers indicate relative ratios of p-GSK-3β vs. GSK-3β compared to the control (set to 1). Nuclear detection of β-catenin in BHY and HN cells after ghrelin stimulation. Lamin B1 was used as nuclear loading control. Protein band intensities were normalized to lamin B1. The numbers indicate relative ratios of β-catenin compared to the control (set to 1). c Relative cyclin D1 and d c-myc expression of BHY and HN cells after ghrelin stimulation. Statistically significant differences vs. control are marked with asterisks [p < 0.05 (*); p < 0.001 (***)]

