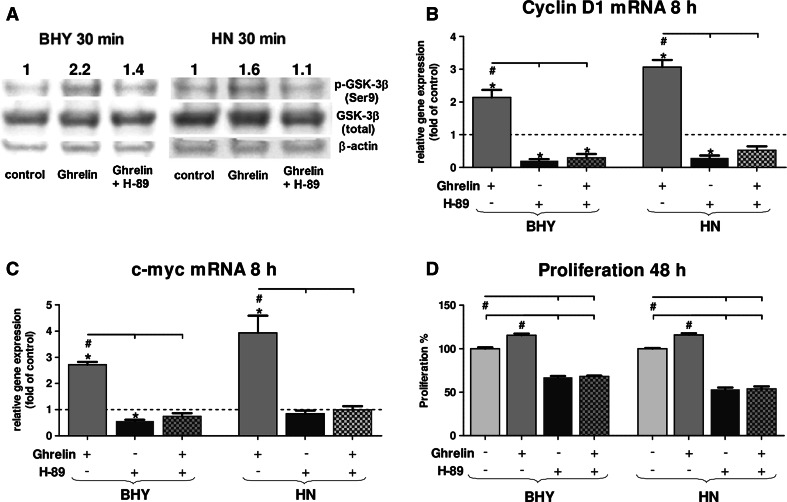
Fig. 3.
Inhibition of PKA signaling by H-89 in BHY and HN cells in the presence of externally applied ghrelin (100 nM). a Western Blot of GSK-3β and phospho-GSK-3β in BHY and HN cells after PKA inhibition. β-actin served as cytosolic loading control. For densitometric analysis, band intensities of p-GSK-3β and GSK-3β were normalized to β-actin. The numbers indicate relatives ratios of p-GSK-3β vs. GSK-3β compared to the unstimulated control (set to 1). b Relative gene expression of cyclin D1. c Relative gene expression of c-myc. d Corresponding proliferation rates of BHY and HN cells. Significant differences (p < 0.05) between groups are marked with (hash) and significant deviations from control with (asterisks)

