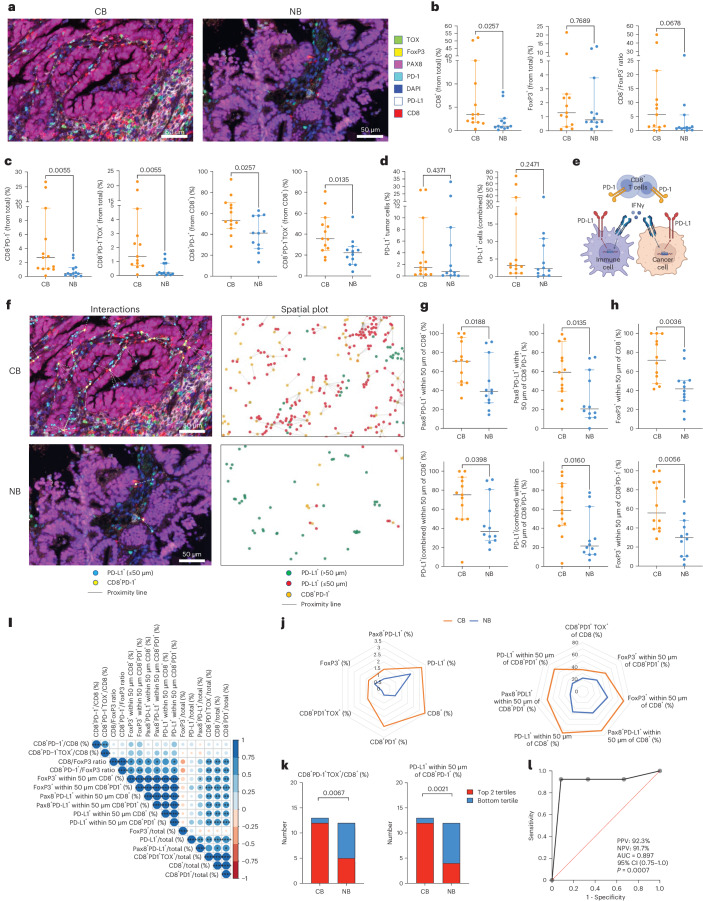
Fig. 3. TME predictors of clinical benefit.
Multiplex immunofluorescence imaging using the Vectra system was performed on archival tissue. Analyses were performed on the tumor compartment after excluding stroma. a, Representative tumor images from the clinical benefit (CB) and no benefit (NB) patients. Markers assessed in the panel are shown. b, Association of CD8+ T cells, FoxP3+ Treg cells and CD8+/FoxP3+ ratios with CB. c, Association of dysfunctional T cells (CD8+PD-1+) and terminally dysfunctional T cells (CD8+PD-1+TOX+) with CB. Relative percentages of the indicated populations out of total cells (left two panels) and out of CD8+ T cells (right two panels) are shown. d, Association of PD-L1 positivity in tumor cells (Pax8+) or tumor and immune cells (combined) with CB. e, Schematic of CD8+ T cell interactions with PD-L1+ cells in the TME. f, Representative interaction maps of CD8+PD-1+ T cells with PD-L1+ cells in the TME. Spatial plots accounting for all PD-L1+ T cells in the TME are shown on the right. g, Interaction CD8+ T cells with PD-L1+ tumor cells (top) and all PD-L1+ cells (bottom). h, Interaction of CD8+ T cells and dysfunctional CD8+ T cells with FoxP3+ cells in the TME. i, Correlation plot of the TME parameters using hierarchical clustering. j, Overall association of TME parameters with CB. k, Association of percentage of CD8+PD-1+TOX+ T cells and proximity of CD8+PD-1+ T cells to PD-L1+ cells with CB using bottom tertiles as cutoffs. l, ROC curve using percentage of CD8+PD-1+TOX+ T cells and proximity of CD8+PD-1+ T cells to PD-L1+ cells as variables. Figure 3b–d,g: n = 25; Fig. 3h: n = 24. Measure of center represents the median, with error bars representing 95% CI. Two-sided P value by Mann–Whitney test without multiple comparison adjustment is shown. Figure 3i: Pearson correlation without multiple comparison adjustment is indicated by circle size and color. P < 0.05, **P < 0.01, ***P < 0.001 and ****P < 0.0001, all two-sided. Figure 3k: n = 25, chi-square statistical comparisons are shown, two-sided P value. NPV, negative predictive value; PPV, positive predictive value. Image in panel (e) was created with BioRender.

