
Extended Data Fig. 1. Proximity between T cells and the nearest PD-L1+ cells.
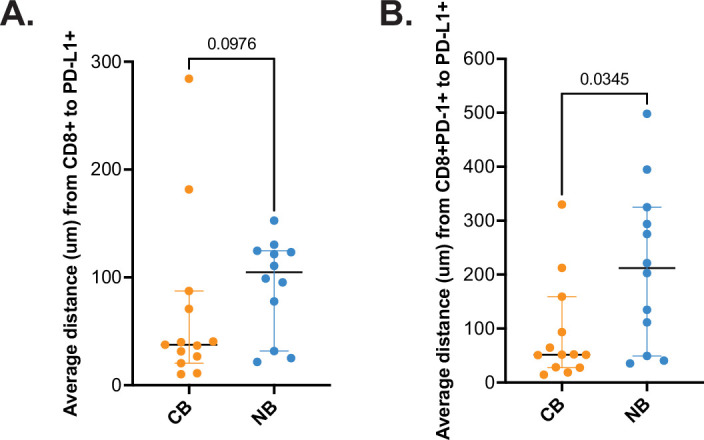
Extended Data Fig. 1 Proximity between T cells and the nearest PD-L1+ cells. Average distances from the CD8+ T cell. (a) or CD8+PD-1+ T cell (b) to the nearest PD-L1+ cell in um were calculated in each sample. Measure of centre represents the median with error bars representing 95% CI. Two-sided P value by Mann-Whitney test without multiple comparison adjustment is shown.