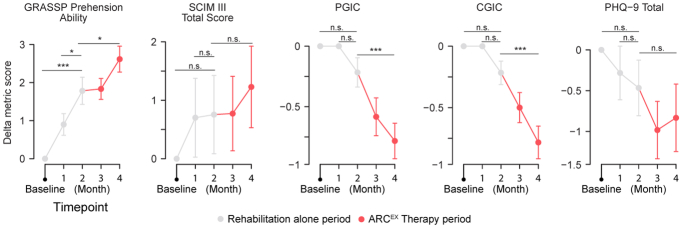
Extended Data Fig. 6. Effect of ARCEX Therapy on additional secondary outcomes.
Improvements in secondary outcome domains during the rehabilitation alone period, and during the ARCEX Therapy period. Lower values of PGIC, CGIC and PHQ-9 represent improved quality of life. These results suggest that a longer period of ARCEX Therapy may promote additional benefits. Red color indicates the period of ARCEX Therapy. Statistics represent one-way repeated measures ANOVA with Tukey HSD post-hoc testing. * = p < 0.05. ** = p < 0.01. *** = p < 0.001. Line graphs represent the mean and standard error of the mean for each outcome measure. Statistics provided in Supplementary Data 3.

