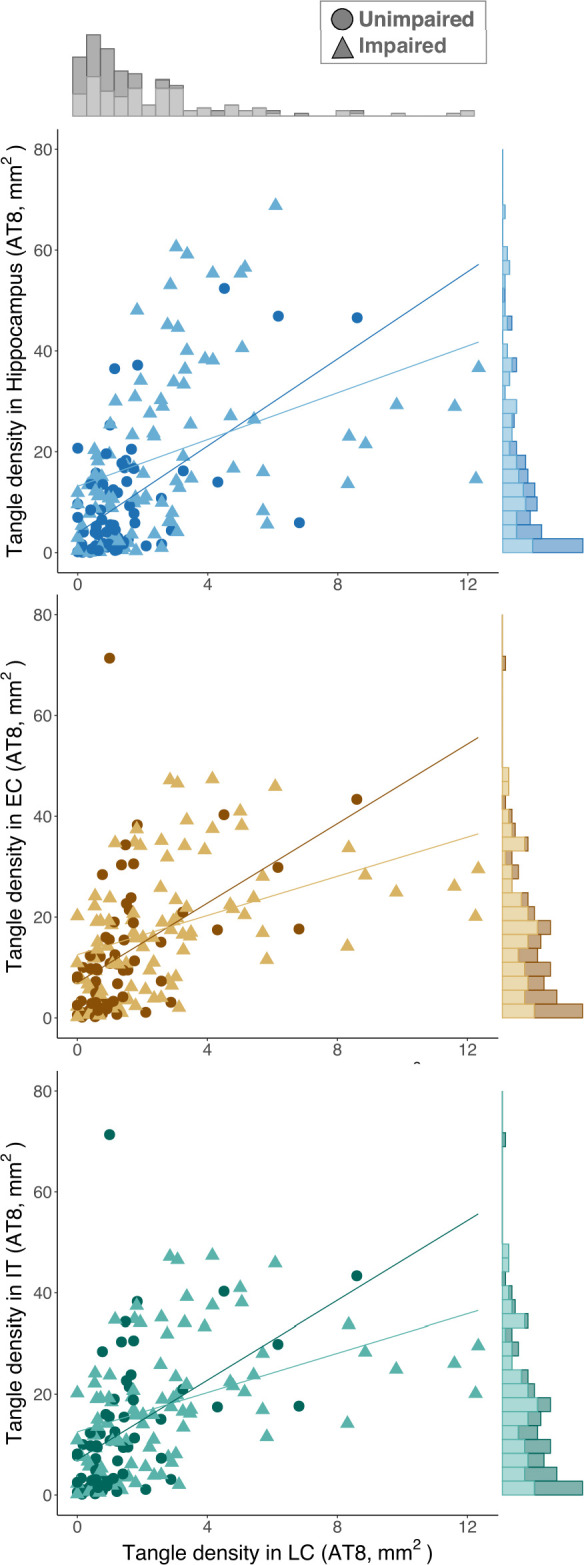
Extended Data Fig. 6. LC tangle density is related to tangles in MTL areas.

In unimpaired participants (EC, N = 65; Hippocampus, N = 66; IT, N = 66; LC, N = 66 independent individuals represented by dots), LC tangle density is related to tangles in MTL structures, such as the hippocampus (upper plot) and the entorhinal cortex (middle plot), and the inferior temporal cortex (lower plot). These associations are consistent with the pattern observed in impaired (EC, N = 93; Hippocampus, N = 94; IT, N = 94; LC, N = 94 independent individuals with mild cognitive impairment or AD; represented by triangles) participants. Lines in the scatter plots represent linear trends. LC tangle density histogram appears on the upper part of the plots, while hippocampus, entorhinal cortex, or inferior temporal cortex tangle density histograms appear on the right-side of the respective plots.
