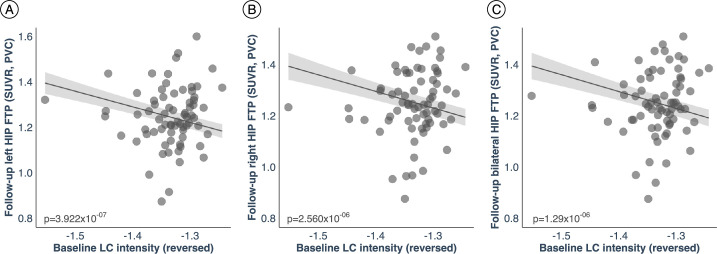
Extended Data Fig. 2. The hypothesized pathological spreading pathway from LC to MTL is supported when adopting a ROI-based approach.
a) Left hippocampus ROI (n = 77 independent individuals); b) Right hippocampus ROI (n = 77 independent individuals); c) Bilateral hippocampus (averaged left and right hippocampus ROIs) (n = 77 independent individuals). The scatter plots reflect the association between baseline LC intensityr and tau accumulation in hippocampus at follow-up (robust linear regression, p < 0.05 two-tailed analysis, uncorrected for multiple comparisons). Plots are adjusted for age, sex, CDR and neocortical PiB burden. In all plots, dots represent the individual predicted values of the relationships tested and the shaded areas around the fit lines show 95% CI. Abbreviations: FTP = 18-flortaucipir PET; HIP=hippocampus; p = p value; PVC=partial volume corrected; SUVR=standardized uptake value ratio.

