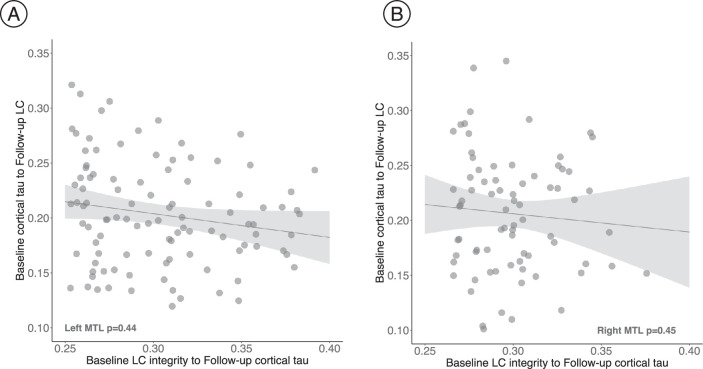
Extended Data Fig. 3. No association was found between our hypothesized tau spreading pathway from LC to MTL, and the reverse model from MTL to LC.
a) Left MTL (n = 186 voxels). b) Right MTL (n = 77 voxels). The scatter plots reflect the association values extracted from the voxels forming the cluster that survived the correction for multiple comparisons when we tested our model (baseline LC integrity to follow-up cortical tau (FTP, SUVR, PVC); robust linear regression, p < 0.05 two-tailed analysis, uncorrected for multiple comparisons). The voxels were kept constant for the reversed model. In all plots, dots represent the estimates (beta-coefficients) of the relationships tested and the shaded areas around the fit lines show 95% CI. Abbreviations: p = p value; LC=locus coeruleus; MTL=medial temporal lobe.

