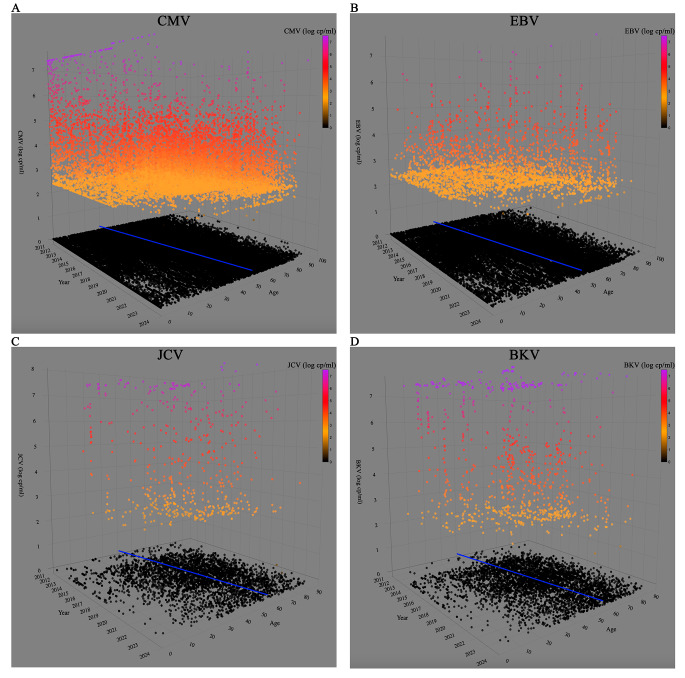
Fig. 3.
A three-dimensional scatter plot is represented for CMV (A), EBV (B), JCV (C) and BKV (D). Each dot represents a sample analyzed in the time frame. Negative samples identified through molecular search for the respective virus are displayed in black. The color scale ranging from yellow to purple represents the variation in the number of genomic copies per ml. Additionally, a blue regression line represents the mean age of the patients

