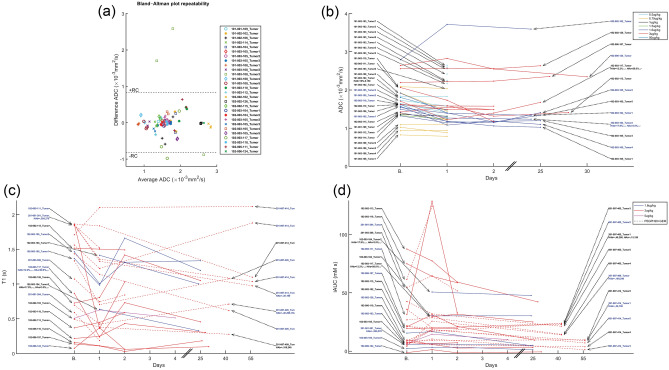
Figure 2.
Median parameter changes at each time point for each tumor. In all parameter change figures, the patient/lesionID in blue indicates a true significant change on Day 1 based on the RC. In the x-axes, “B.” indicates the baseline time point. In patients with available HA levels, HAb is the baseline HA level (HA%, tumor, and stroma H-score) and HAa is the post-PEGPH20 HA level. In ADC, where repeated scans were available, Bland–Altman plot describing median ADC repeatability is also shown, where each marker/color represents a baseline ADC replicate difference.

