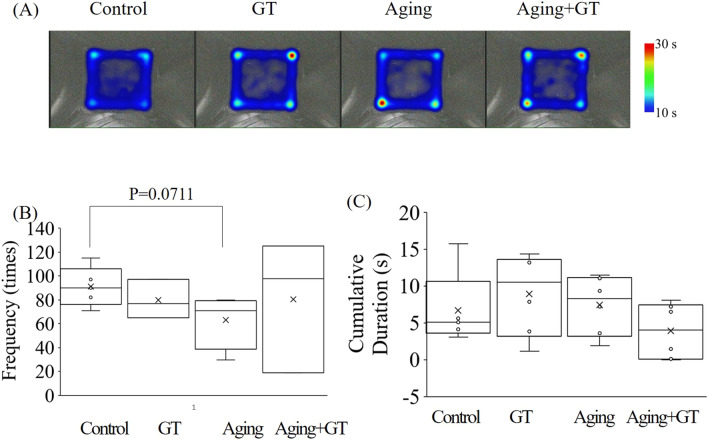
Figure 2.
Open-field test, indicating no difference in locomotion between the groups. (A) Heat map diagrams between the groups. Warm and cold colors refer to longer and shorter stay in the area, respectively. (B) Frequency quantification of passing the center in each group. The data indicates a lower frequency in the aging group compared to the control with a nearly significant difference. (C) Cumulative duration of staying in the center area with no differences among the groups. N = 6 except control (N = 5).

