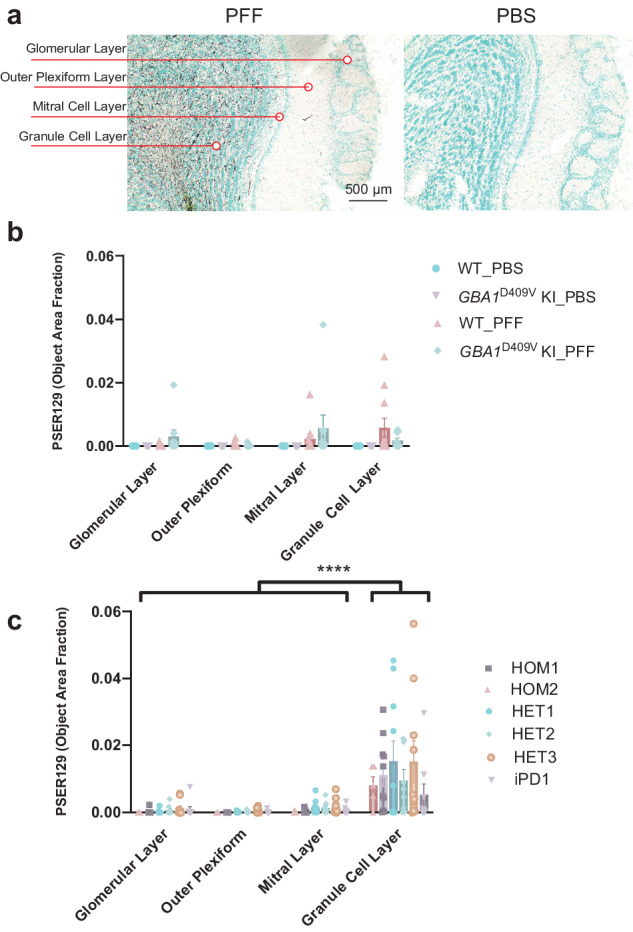
Fig. 3. Distribution of αsyn pathology across OB layers following PFF injection into mouse OB.

a Representative images of PFF and PBS injected OB showing distribution of PK-PSER129 reactivity across OB layers. Each layer quantified is annotated to the left of the images. b Quantification of PK-PSER129 across the layers of WT and homozygous GBA1D409V KI mice seeded with PFFs. c Quantification of PK-PSER129 across the layers of WT mice treated with various strains of αsyn PFFs amplified from PD and GBA-PD clinical specimens. **** F (1.021, 47.97) = 26.42, P < 0.0001. For b, PBS_WT n = 22, PFF_WT n = 11, PBS_GBA1D409V KI n = 10, PFF_ GBA1D409V KI n = 9. For C, HET1 n = 10, HOM1 n = 10, HOM2 n = 5, iPD1 n = 9, HET2 n = 9, HET3 n = 10. Error bars denote standard error of the mean.
