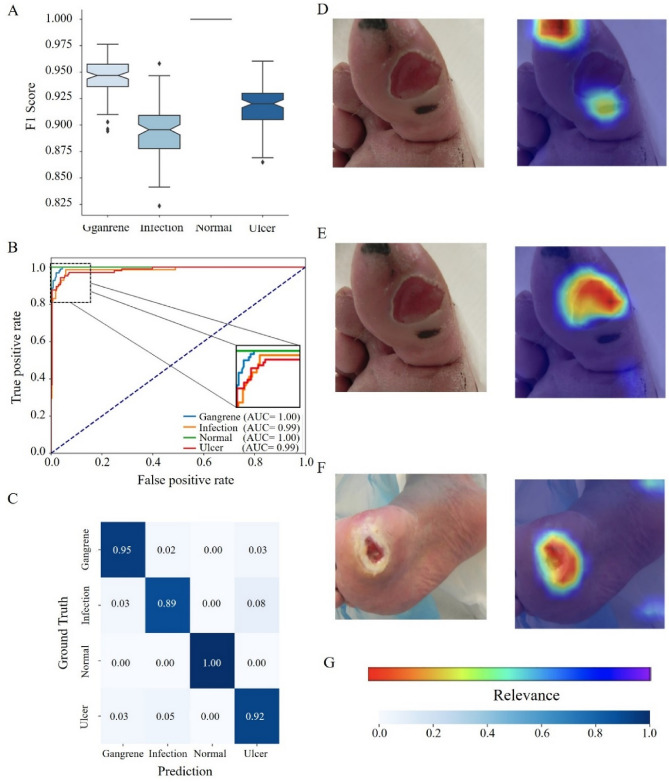
Figure 4.
Performance analysis of ScoreDFUNet. (A) F1-score Performance: Illustrates the F1-score performance of the Clf4DFU model, showcasing its ability to achieve a balanced trade-off between precision and recall in diabetic foot ulcer classification. (B) ROC Curve: Presents the receiver operating characteristic (ROC) curve, highlighting the model's effectiveness in distinguishing between different lesion categories. (C) Confusion Matrix: Provides a comprehensive breakdown of the model's stratification results, facilitating a detailed assessment of its accuracy and potential areas for improvement. (D–F) Feature Influence Analysis: Offers both qualitative and quantitative saliency analysis, emphasizing the significance of various diabetic foot ulcer features in influencing the model's predictions. (G) Relevance Colorbar.

