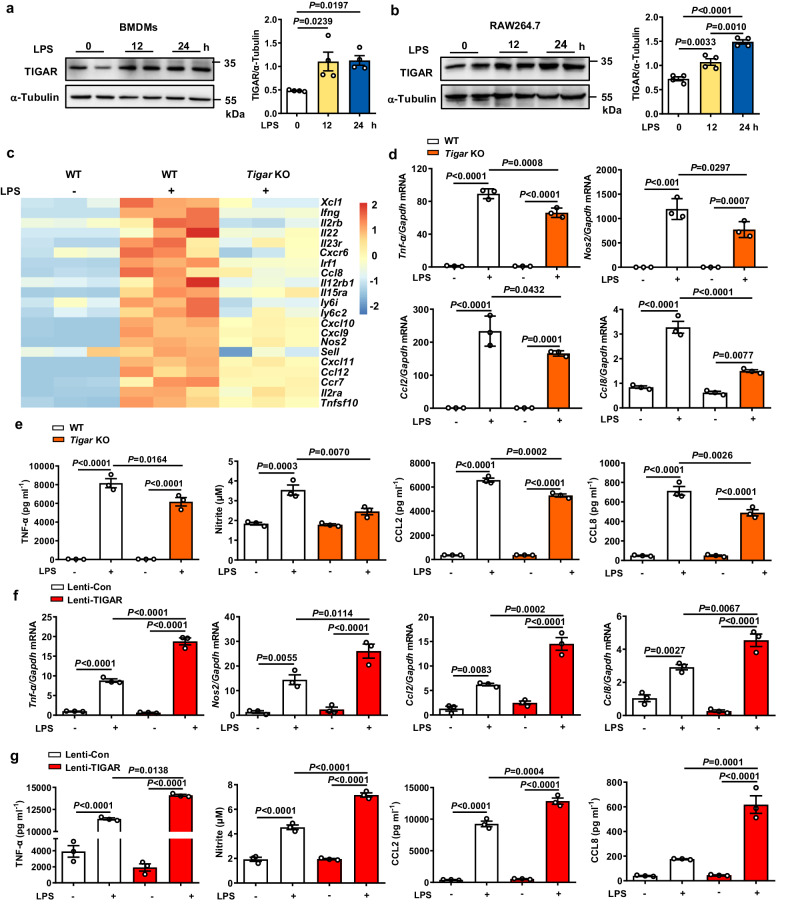
Fig. 2. TIGAR activates pro-inflammatory responses in macrophages.
a, b Western blot analysis of TIGAR expression in BMDMs (a) and RAW264.7 cells (b) stimulated with LPS (100 ng ml−1) for indicated times, n = 4 samples. c Heatmap of the selected pro-inflammatory genes transcript expressions in Tigar KO BMDMs stimulated with LPS for 8 h compared to WT controls. d, e BMDMs isolated from WT and Tigar KO mice were stimulated with LPS for 8 h. mRNA levels of pro-inflammatory genes including Tnf-α, Nos2, Ccl2, and Ccl8 were assessed (n = 3) (d). TNF-α, CCL2, and CCL8 levels in culture media were determined using ELISA. Nitrite, the end product of NO metabolism, was measured by Griess reagent (n = 3) (e). f, g RAW264.7 cells were transfected by Lenti-viruses expressing control Flag (Lenti-Con) and Flag-TIGAR (Lenti-TIGAR) for 72 h followed by LPS treatment for 12 h. mRNA levels of the pro-inflammatory genes in RAW264.7 cells (n = 3) (f). TNF-α, CCL2, and CCL8 levels in culture media were determined using ELISA. Nitrite, the end products of NO metabolism, measured by Griess reagent (n = 3) (g). a, b, d–g One-way ANOVA followed by the Bonferroni test. Source data are provided as a Source Data file.

