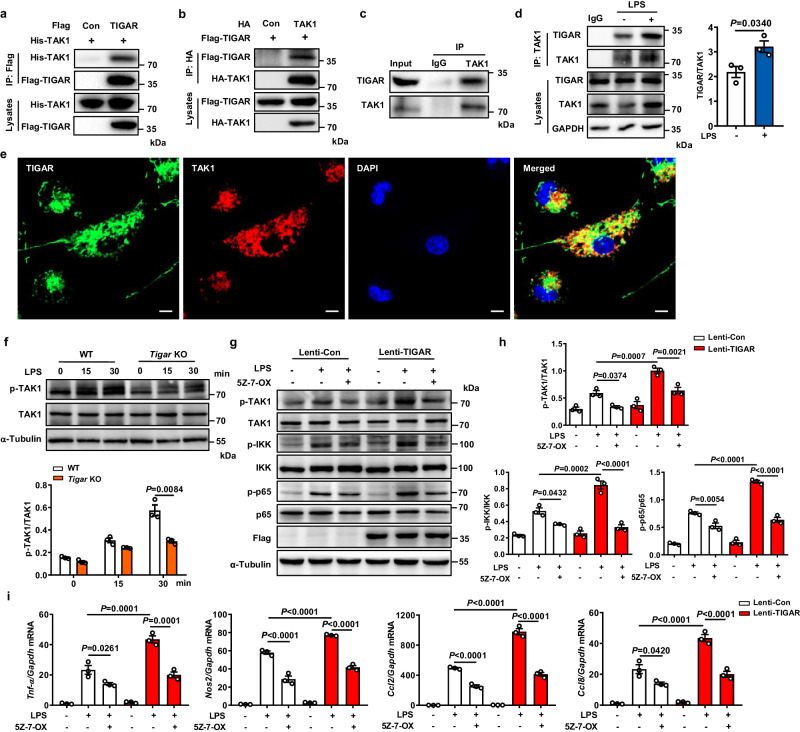
Fig. 4. TIGAR ablation inhibits TAK1 activation.
a HEK293 cells were transfected by His-TAK1, Flag-TIGAR, or Flag empty vector. Co-IP and western blot of TAK1 and TIGAR in the transfected cells. b HEK293 cells were transfected by Flag-TIGAR, HA-TAK1, or HA empty vector. Co-IP and western blot of TIGAR and TAK1 in the transfected cells. c Co-IP and western blot of endogenous TIGAR and TAK1 in BMDMs. d Co-IP and quantifications of endogenous TIGAR and TAK1 in BMDMs stimulated by LPS. n = 3 independent experiments. e Confocal microscopic images of TIGAR (green) and TAK1 (red) in PMs. Scale bars, 5 μm. Images were representative images from three independent experiments. f Western blot of TAK1 in BMDM lysates from WT and Tigar KO mice treated by LPS for the indicated times using the indicated antibodies, n = 3 samples. g RAW264.7 cells were transfected with Lenti-Con or Lenti-TIGAR for 72 h followed by LPS treatment with or without TAK1 inhibitor 5Z-7-OX (100 nM) for 30 min. Western blot analysis of cell lysates using the indicated antibodies. h Quantifications of the phosphorylation and total TAK1, IKK, and p65 in the indicated groups, n = 3 samples. i mRNA levels of pro-inflammatory genes in RAW264.7 cells followed by LPS treatment with or without TAK1 inhibitor 5Z-7-OX (100 nM) for 12 h (n = 3). Data are expressed as mean ± SEM. d Two-tailed Student t-test. f Two-way ANOVA followed by the Bonferroni test. h, i One-way ANOVA followed by the Bonferroni test. All blot assays were repeated three times independently with similar results. Source data are provided as a Source Data file.

