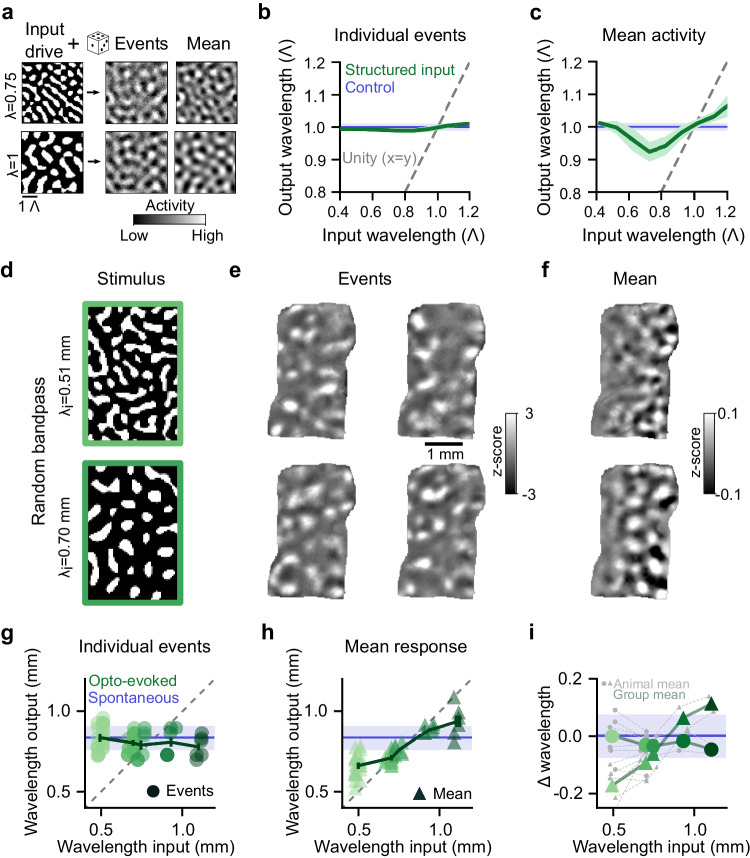
Fig. 4. Cortical networks shift activity towards the characteristic wavelength.
a–c Computational model shows transformation of input wavelength predicted by a LE/LI mechanism in the presence of strong noise. a Structured input drive into network generates modular outputs that show wavelength transformations. b Wavelength of individual events for structured input drive of varying wavelength (green, mean (+/−SD)) closely matches the characteristic wavelength (Λ) generated by white-noise input (blue, mean (+/−SD)), largely independent of the dominant wavelength of structured input. Data plotted in units of Λ. c Mean activity across model events (green, mean (+/−SD)) shows a wavelength in between the input wavelength (gray dashed line) and Λ (blue, mean (+/−SD)). d In vivo optogenetic stimulation with random patterns of varying wavelength. e Individual events show opto-evoked, modular activity with wavelength that appears unaffected by the input wavelength. f Mean activity across events shows wavelengths shifted towards input wavelength. g Across a range of input wavelengths, individual opto-evoked events show a wavelength that closely matches the characteristic wavelength observed in spontaneous activity (Λ, blue line = mean (+/−SD)). Dots show individual animals, mean (+/−SEM) across trials, n = 90 stimulus patterns from 8 animals. h Same as g, but for the wavelength of mean response. Mean activity is biased away from input wavelength (gray line) towards Λ (blue). i Change from Λ (blue, mean (+/−SD)) for individual events (circles) and mean activity (triangles). Gray = individual animals, green = mean across animals.

