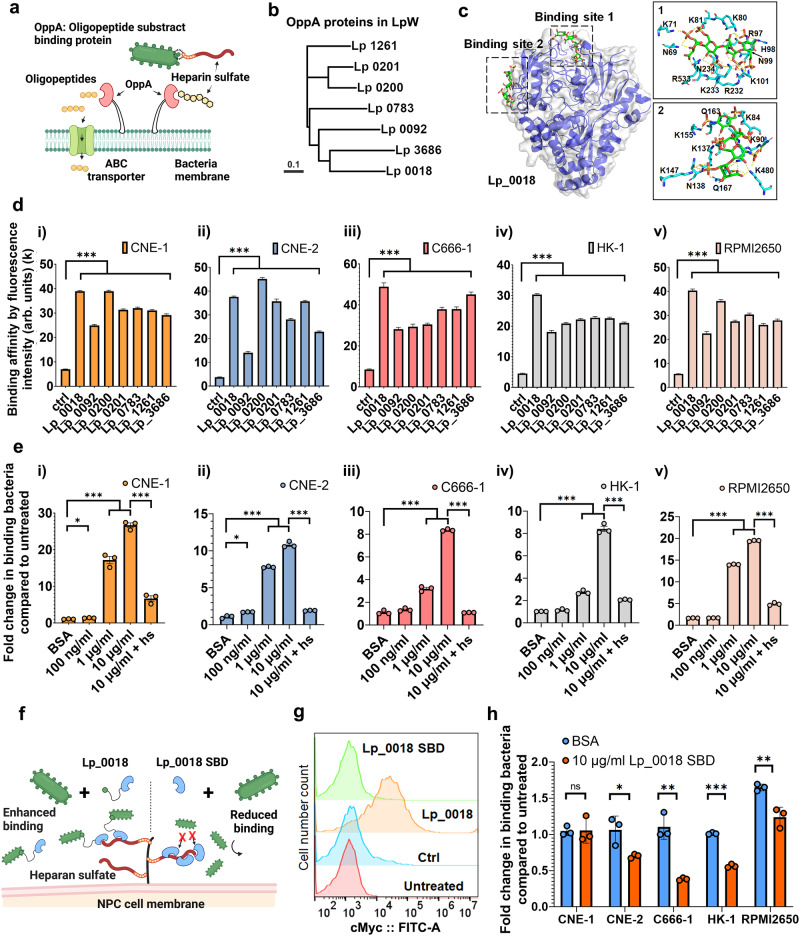
Fig. 3. Identification of cancer binding protein from L. plantarum cell surface.
a Schematics showing OppA protein binding to heparan sulfate. b Polygenetic trees of OppA proteins in Lp. The scale bar indicates 0.1 amino acid replacements per site. c Alpha-fold prediction model of Lp_0018 and the simulation of its heparin docking complex. d Binding affinity of OppA proteins toward all NPCs by flow cytometry analysis. n = 10,000 events. Data are presented as geometric means ± SEM. (All p values < 0.0001. Detailed calculations p values are provided in the Source Data file). e Increased Lp-NPC binding by the addition of Lp_0018. n = 3 experimental replicates. Data are presented as mean values ± SEM. (P values in CNE-1 group 100 ng/ml vs BSA = 0.0047, 1 μg/ml vs control = 7.48 × 10⁻⁷, 10 μg/ml vs control = 2.44 × 10⁻⁶, 10 μg/ml vs 10 ug/ml + hs = 3.52 × 10⁻⁵; in CNE-2 group 0.0043, 0.0110, 2.79 × 10⁻⁶, 2.72 × 10⁻⁶; in C666-1 group 0.1307, 0.0002, 3.63 × 10⁻⁷, 2.01 × 10⁻⁸; in HK-1 group 0.1161, 6.88 × 10⁻⁵, 7.08 × 10⁻⁶, 1.33 × 10⁻⁵; in RPMI2650 group =0.4641, 6.25 × 10⁻⁹, 3.74 × 10⁻⁹, 2.35 × 10⁻⁷). f Schematics showing Lp_0018 enhancing and Lp_0018 SBD reducing Lp-NPC binding. g Binding of Lp_0018 to the surface of Lp. n = 10,000 events. h Reduction of Lp-NPC binding by the addition of Lp_0018 SBD. n = 3 experimental replicates. Data are presented as mean values ± SEM. (P values in CNE-1 group = 0.9384, in CNE-2 group = 0.0315, in C666-1 = 0.0020, in HK-1 group = 8.82 × 10⁻⁶, in RPMI2650 group = 0.0078). Unpaired two-sided Student’s t tests were performed to determine the statistical significance. *P < 0.05; **P < 0.01; ***P < 0.001. Source data are provided as a Source Data file.

