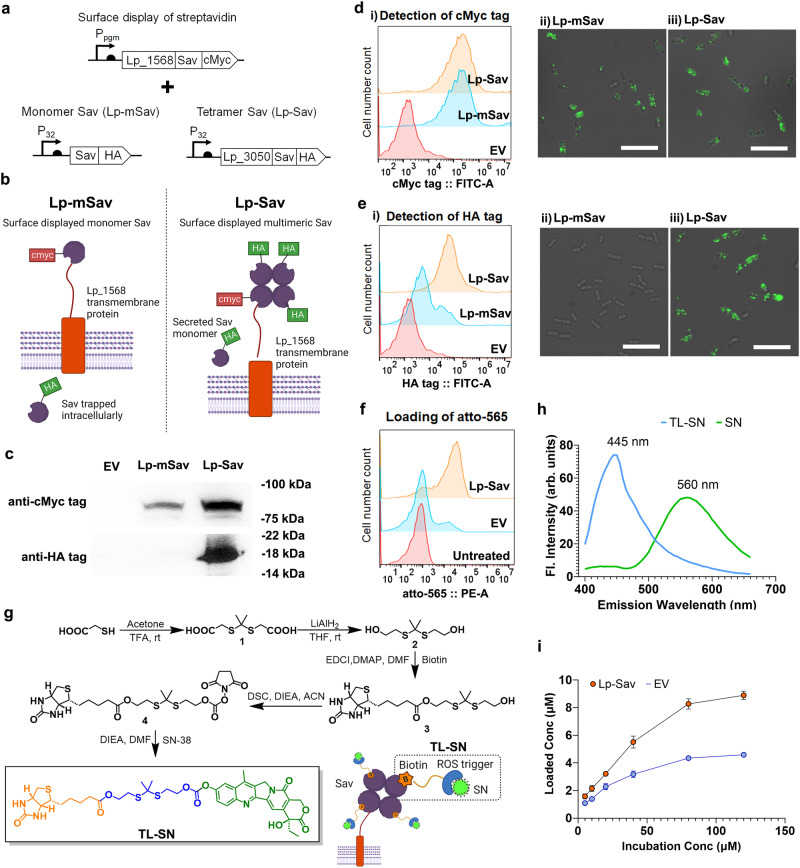
Fig. 4. Surface display of streptavidin and loading of the prodrug on L. plantarum WCFS1.
a Expression cassette for Sav surface display in Lp. b Schematics of the tetramer Sav surface display. c Western blot images showing the surface display of the Lp_1568-Sav fusion protein and secreted Sav protein. d Detection of Lp_1568-Sav fusion protein on the Lp cell surface. (i) Flow cytometry analysis and (ii) IF. Scale bars, 25 µm. e Detection of multimeric Sav on the Lp cell surface via (i) flow cytometry analysis and (ii) IF. Scale bars, 25 µm. f Loading of a biotinylated fluorescent probe on the Lp cell surface. g Schematics showing the synthesis route of TL-SN and the loading of TL-SN. h Fluorescence spectrum scanning showing the optimal emission wavelengths of TL-SN and SN. i Loading of TL-SN on the Lp-Sav and EV strains. n = 3 bacterial cultures. Data are presented as mean values ± SEM. Source data are provided as a Source Data file.

