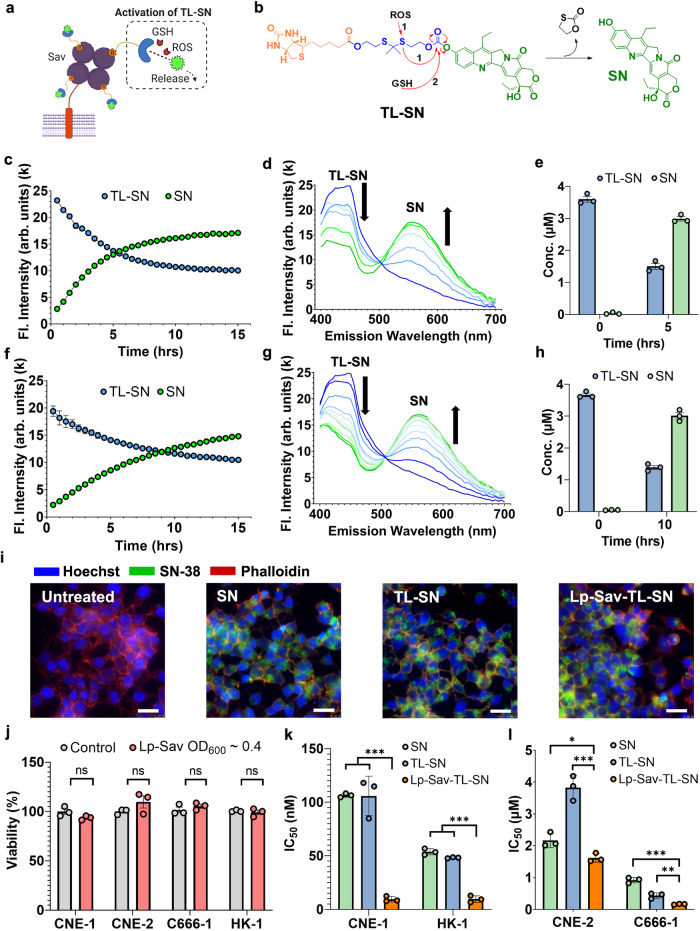
Fig. 5. Release of prodrug 1 from Lp-Sav and in vitro characterization of prodrug-loaded Lp-Sav in NPC cells.
a, b Schematics showing the mechanism of TL-SN activation and SN release. c, f Activation of TL-SN and release of SN in TL-SN-loaded Lp-Sav over time. d, g Dynamics of TL-SN activation by spectrum scanning over time. e, h Concentration of TL-SN in the cell pellet and SN in the supernatant pre- and postactivation. c–e The activation of TL-SN via H2O2; (f), (g), (h) - the activation of TL-SN via GSH. (i) Accumulation of SN in C666-1 cells after TL-SN activation: 24 h incubation time. Red – β-actin stained by phalloidin. Blue – nucleus stained by Hoechst. Green – SN. Scale bars, 25 µm. j Viability of NPC cells after 24 h of coculture with unloaded Lp-Sav at OD600 ~ 0.4. k, l IC50 of various treatments in NPC cells. The assays were performed with three biological repeats. All data are presented as mean values ± SEM. (P values in CNE-1 group SN vs Lp-Sav-TL-SN = 7.19 × 10⁻⁷, TL-SN vs Lp-Sav-TL-SN = 0.0008; in HK-1 group 5.66 × 10⁻⁵, 2.91 × 10⁻⁵; in CNE-2 group 0.0233, 0.0008; in C666-1 group 0.0001, 0.0058). Unpaired two-sided Student’s t tests were performed to determine the statistical significance. *P < 0.05; **P < 0.01; ***P < 0.001. Source data are provided as a Source Data file.

