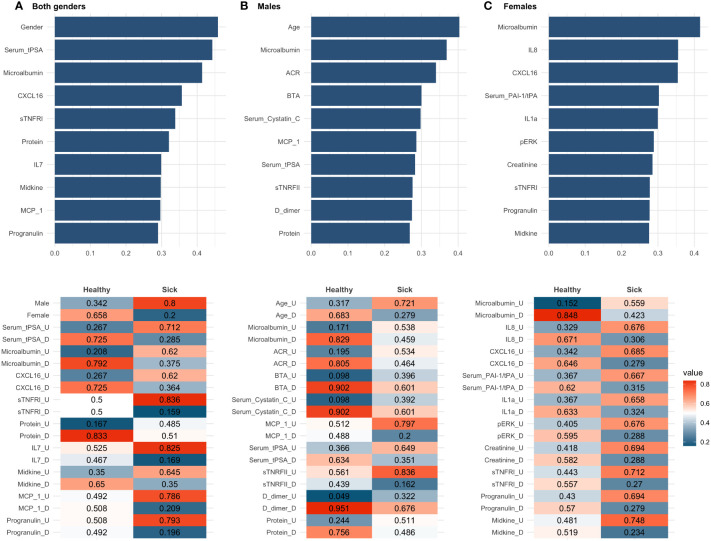
Figure 5.
CACTUS analysis results for all three data subsets: (A) both genders dataset, (B) males dataset, (C) females dataset. The top panel presents the ten most important biomarkers according to the rank values. The bottom panel presents probability of flips for sick and healthy in descending order of rank value.

