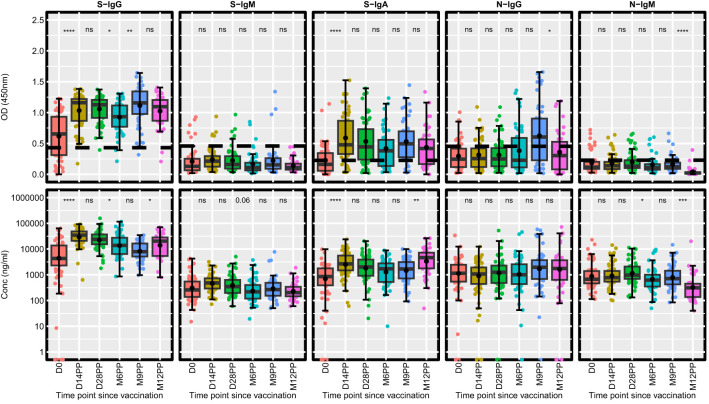
Figure 2.
Longitudinal Analysis of Antibody Responses Over 12 months Following Administration of the Single-Dose Janssen Ad26.COV2.S COVID-19 Vaccine. This figure illustrates the antibody response levels, measured in optical density (OD) and concentration (ng/ml), throughout the study period. Each boxplot displays the interquartile range, with the mean represented by a black solid circle and the median by a horizontal line. Statistical analysis of the antibody response variation over time was conducted using an unpaired Wilcoxon test, with a Hochberg correction for multiple comparisons. Significance thresholds are indicated as: ‘ns’ for p > 0.05 (non-significant), ‘*’ for p ≤ 0.05, ‘**’ for p < 0.01, ‘***’ for p < 0.001, and ‘****’ for p < 0.0001.

