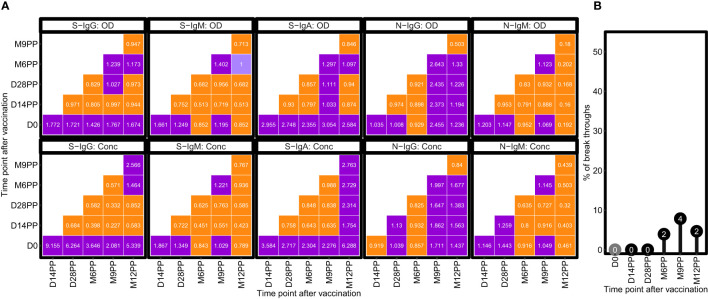
Figure 3.
Temporal Dynamics of Median Antibody Response and Incidence of Breakthrough Cases Post-Vaccination. (A) illustrates the median fold changes in antibody responses between sequential time points. Fold changes are quantified as ratios, with a value of one indicating no change, values greater than 1 denoting an increase, and values less than one signifying a decrease. Increases in antibody responses are highlighted in red, decreases in green, and instances with no change are marked in orange. (B) delineates the prevalence of presumed infection and breakthrough cases in the study cohort, measured by the change in N-IgG antibody levels, before and after completion of the COVID-19 vaccination regimen. Grey circles indicate the percentage of subjects presumed infected at each time point before completing the vaccination regimen, while black circles represent the percentage of breakthrough cases post-full vaccination. The y-axis quantifies these percentages. Breakthrough cases, defined as subjects with an 11-fold increase in N-IgG levels indicative of infection occurring 14 days or more after the complete vaccination, amounted to three individuals, all of whom were identified six months post-vaccination.

