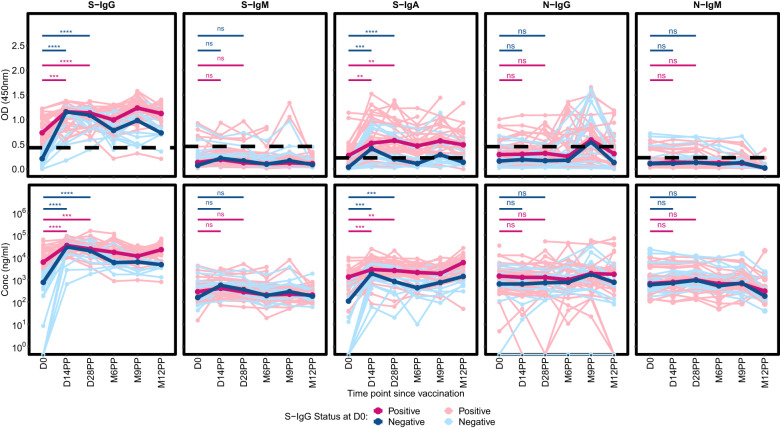
Figure 4.
Comparative Profiling of Median Spike-Directed Antibody Responses Post-Janssen Ad26.COV2.S COVID-19 Vaccination Stratified by Baseline S-IgG Seropositivity. This figure depicts the individual trends in Spike-directed antibody responses (light-shaded lines) and the median responses (dark, thicker lines), categorized based on baseline S-IgG antibody levels. Subjects are classified as S-IgG positive (shown in red) if their baseline S-IgG levels are at or above the established cutoff value and S-IgG negative (illustrated in blue) if below this threshold. The data tracks these antibody responses over 12 months following the initial vaccination, providing a detailed temporal view of the immune response elicited by the Ad26.COV2.S COVID-19 Janssen vaccine. Differences in antibody responses between D0 and D14PP as well as D0 and D28PP for each subgroup were assessed using a Wilcoxon test. Significance bars (red for baseline S-IgG positive and blue for baseline S-IgG negative) indicate the levels of significance;: ‘ns’ for p > 0.05 (non-significant), ‘*’ for p ≤ 0.05, ‘**’ for p < 0.01, ‘***’ for p < 0.001, and ‘****’ for p < 0.0001.

