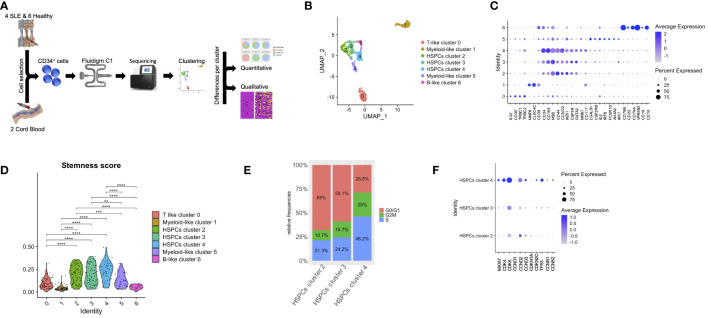
Figure 1.
Lineage-specific alterations in HSPCs using single-cell transcriptomics in patients with SLE. (A) Diagram of analysis pipeline. (B) Uniform manifold approximation and project (UMAP) visualization of HSPC cells (CD34+) irrespective of disease or developmental stage (cord blood, n = 2, healthy bone marrow (BM), n = 6, SLE BM, n = 4) based on single-cell transcriptomes. Each dot represents a single cell; colors indicate cell clusters with numbered labels and cell type annotations. (C) Dot plot of selected marker genes in each identified cluster. (D) Violin plots of stemness signature score of each cluster (Mann–Whitney rank-sum test p values, **p < 0.01, ***p < 0.001, ****p < 0.0001). (E) Bar plot of cell-cycle phase assignments for captured cells in the HSPC clusters 2, 3, 4. (F) Dot plot of selected cell-cycle genes in HSPC clusters 2, 3, 4.

