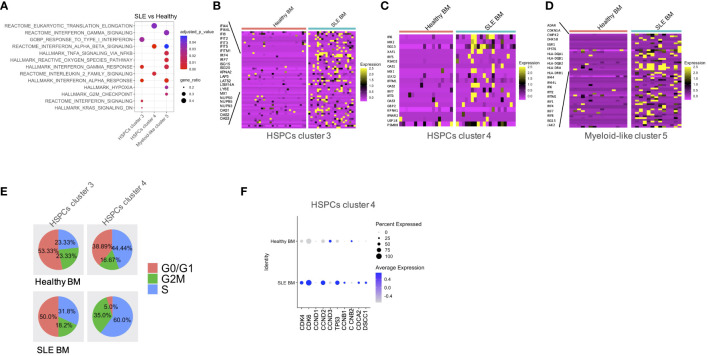
Figure 3.
Qualitative differences in patients with SLE compared with healthy controls. (A) Dot plot of GSEA enriched terms following differential expression analysis between SLE and healthy controls in HSPC clusters 3 and 4 and myeloid-like cluster 5. (B–D) Heatmaps of genes supporting the enriched IFN-related pathways in SLE BM vs. healthy controls in HSPC clusters 3 and 4 and myeloid-like cluster 5, respectively. (E) Pie charts showing the composition of each cell-cycle phase in healthy BM and SLE BM in HSPC clusters 3 and 4. (F) Dot plot of selected cell-cycle genes in healthy BM and SLE BM in HSPC clusters 4.

