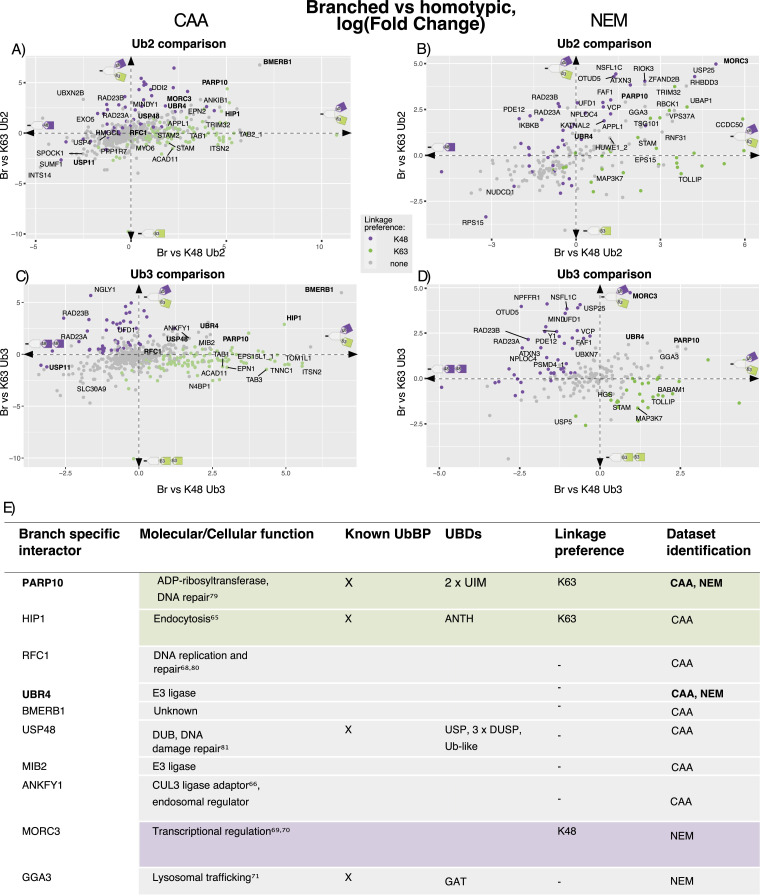
Figure 4. K48/K63-linked branched Ub chain interactors.
(A, B, C, D) Scatterplots of Br Ub3 versus homotypic Ub2 (A, B) or Ub3 (C, D) interactors. (A, B, C, D) Scatterplots (A, C) from the chloroacetamide dataset and (B, D) from the N-ethylmaleimide dataset. Comparison of K63 Ub plotted on the y-axis and K48 Ub plotted on the x-axis. Two-sample moderated t tests on prefiltered Ub-enriched interactors. Dot colour indicates linkage preference by a two-sample moderated t test of K48 Ub3 versus K63 Ub3 (Adj.P < 0.05): purple is significantly enriched on K48, green is significantly enriched on K63, and grey is not statistically significant. Labelled proteins were statistically significant in the Br Ub3 versus homotypic chain comparisons on both axes. Proteins labelled in bold were significant in at least four Br Ub3 versus homotypic chain comparisons across datasets. Adj.P < 0.05. (C, D, E) Table of branch-specific interactors identified by significant enrichment on Br Ub3 over both homotypic K48 and K63 Ub3 chains (C, D). PARP10 and UBR4 labelled in bold were significantly enriched on Br Ub3 in every homotypic Ub chain comparison in both datasets. A two-sample moderated t test of prefiltered Ub-enriched interactors, log(FC) > 0, Adj.P < 0.05.

