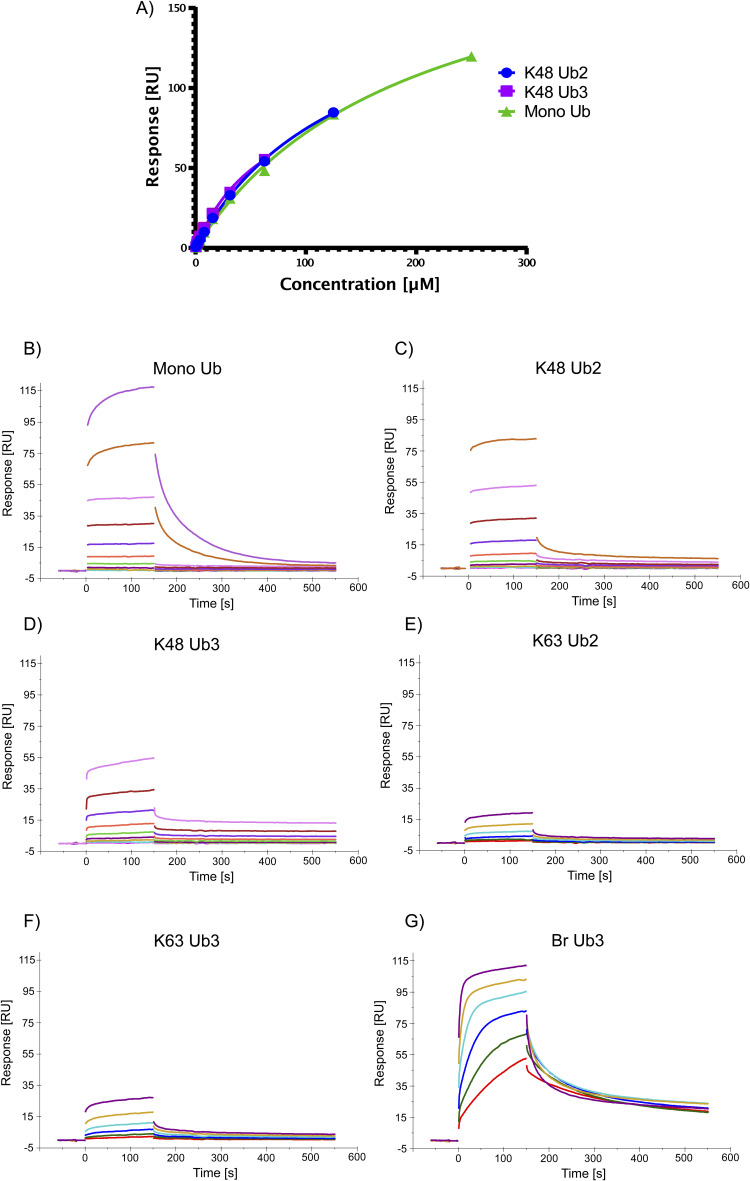
Figure S12. HIP1(22-309) Ub-binding assay raw data.
(A) Overlaid affinity plots of triplicate measurements of K48 Ub2, K48 Ub3, and mono-Ub interacting with immobilized biotinylated HIP1(22-309) protein. Averaged response values (RU) at equilibrium are plotted against the injected concentration (μM) of respective analytes determined by surface plasmon resonance multicycle format and fitted according to a steady-state affinity model. (B, C, D, E, F, G) Sensorgrams of (B) mono-Ub, (C) K48 Ub2, (D) K48 Ub3, (E) K63 Ub2, (F) K63 Ub3, and (G) Br Ub3 binding to immobilized HIP1(22-309), by surface plasmon resonance. Response values (RU) are plotted against time in seconds.

