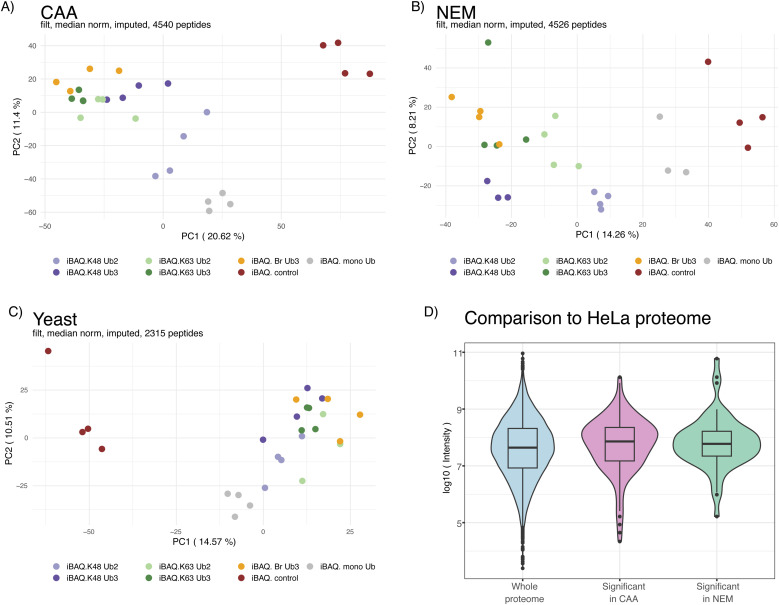
Figure S2. Ubiquitin interactor enrichment MS quality control.
(A, B, C) Principal component analysis of ubiquitin interactor pulldown samples from the (A) chloroacetamide (CAA)-treated HeLa lysate, (B) N-ethylmaleimide-treated HeLa lysate, and (C) CAA-treated yeast lysate. Obtained by LC-MS. Each axis in the plot represents a principal component, with the percentage of variance explained by each component indicated in brackets. Dots coloured by sample type. (D) Protein abundance from deep HeLa proteome (37) of all proteins identified by ubiquitin interactor pulldown compared with that of significant hits in each dataset only. Log10 of intensity values after tryptic digest from reference 37 deep HeLa proteome plotted on the y-axis as protein abundance. Isoforms and proteins not identified in deep proteome were excluded. Significant differently enriched proteins from the CAA- and N-ethylmaleimide-treated lysate by a moderated F test of prefiltered Ub-enriched interactors (Adj.P < 0.05).

