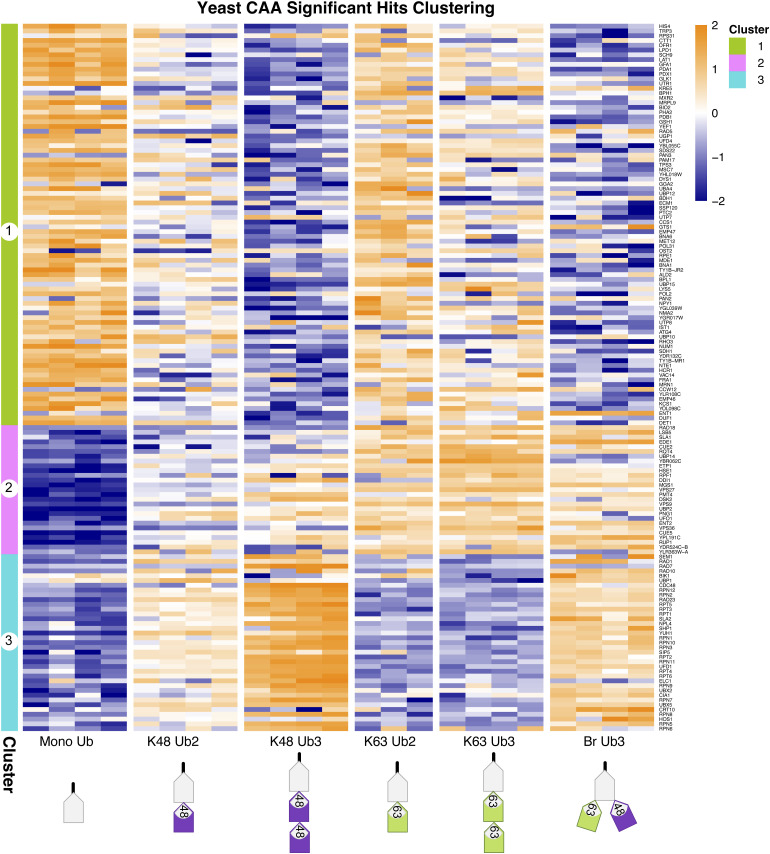
Figure S8. Clustering of significant hits in yeast dataset.
Clustered heatmap of significant hits in yeast dataset, identified by a moderated F test after Ub enrichment prefiltering (Adj.P < 0.05). Hierarchical clustering by the Euclidean distance. Heatmap of iBAQ values, scaled by row using z scoring.

