
Figure 3.
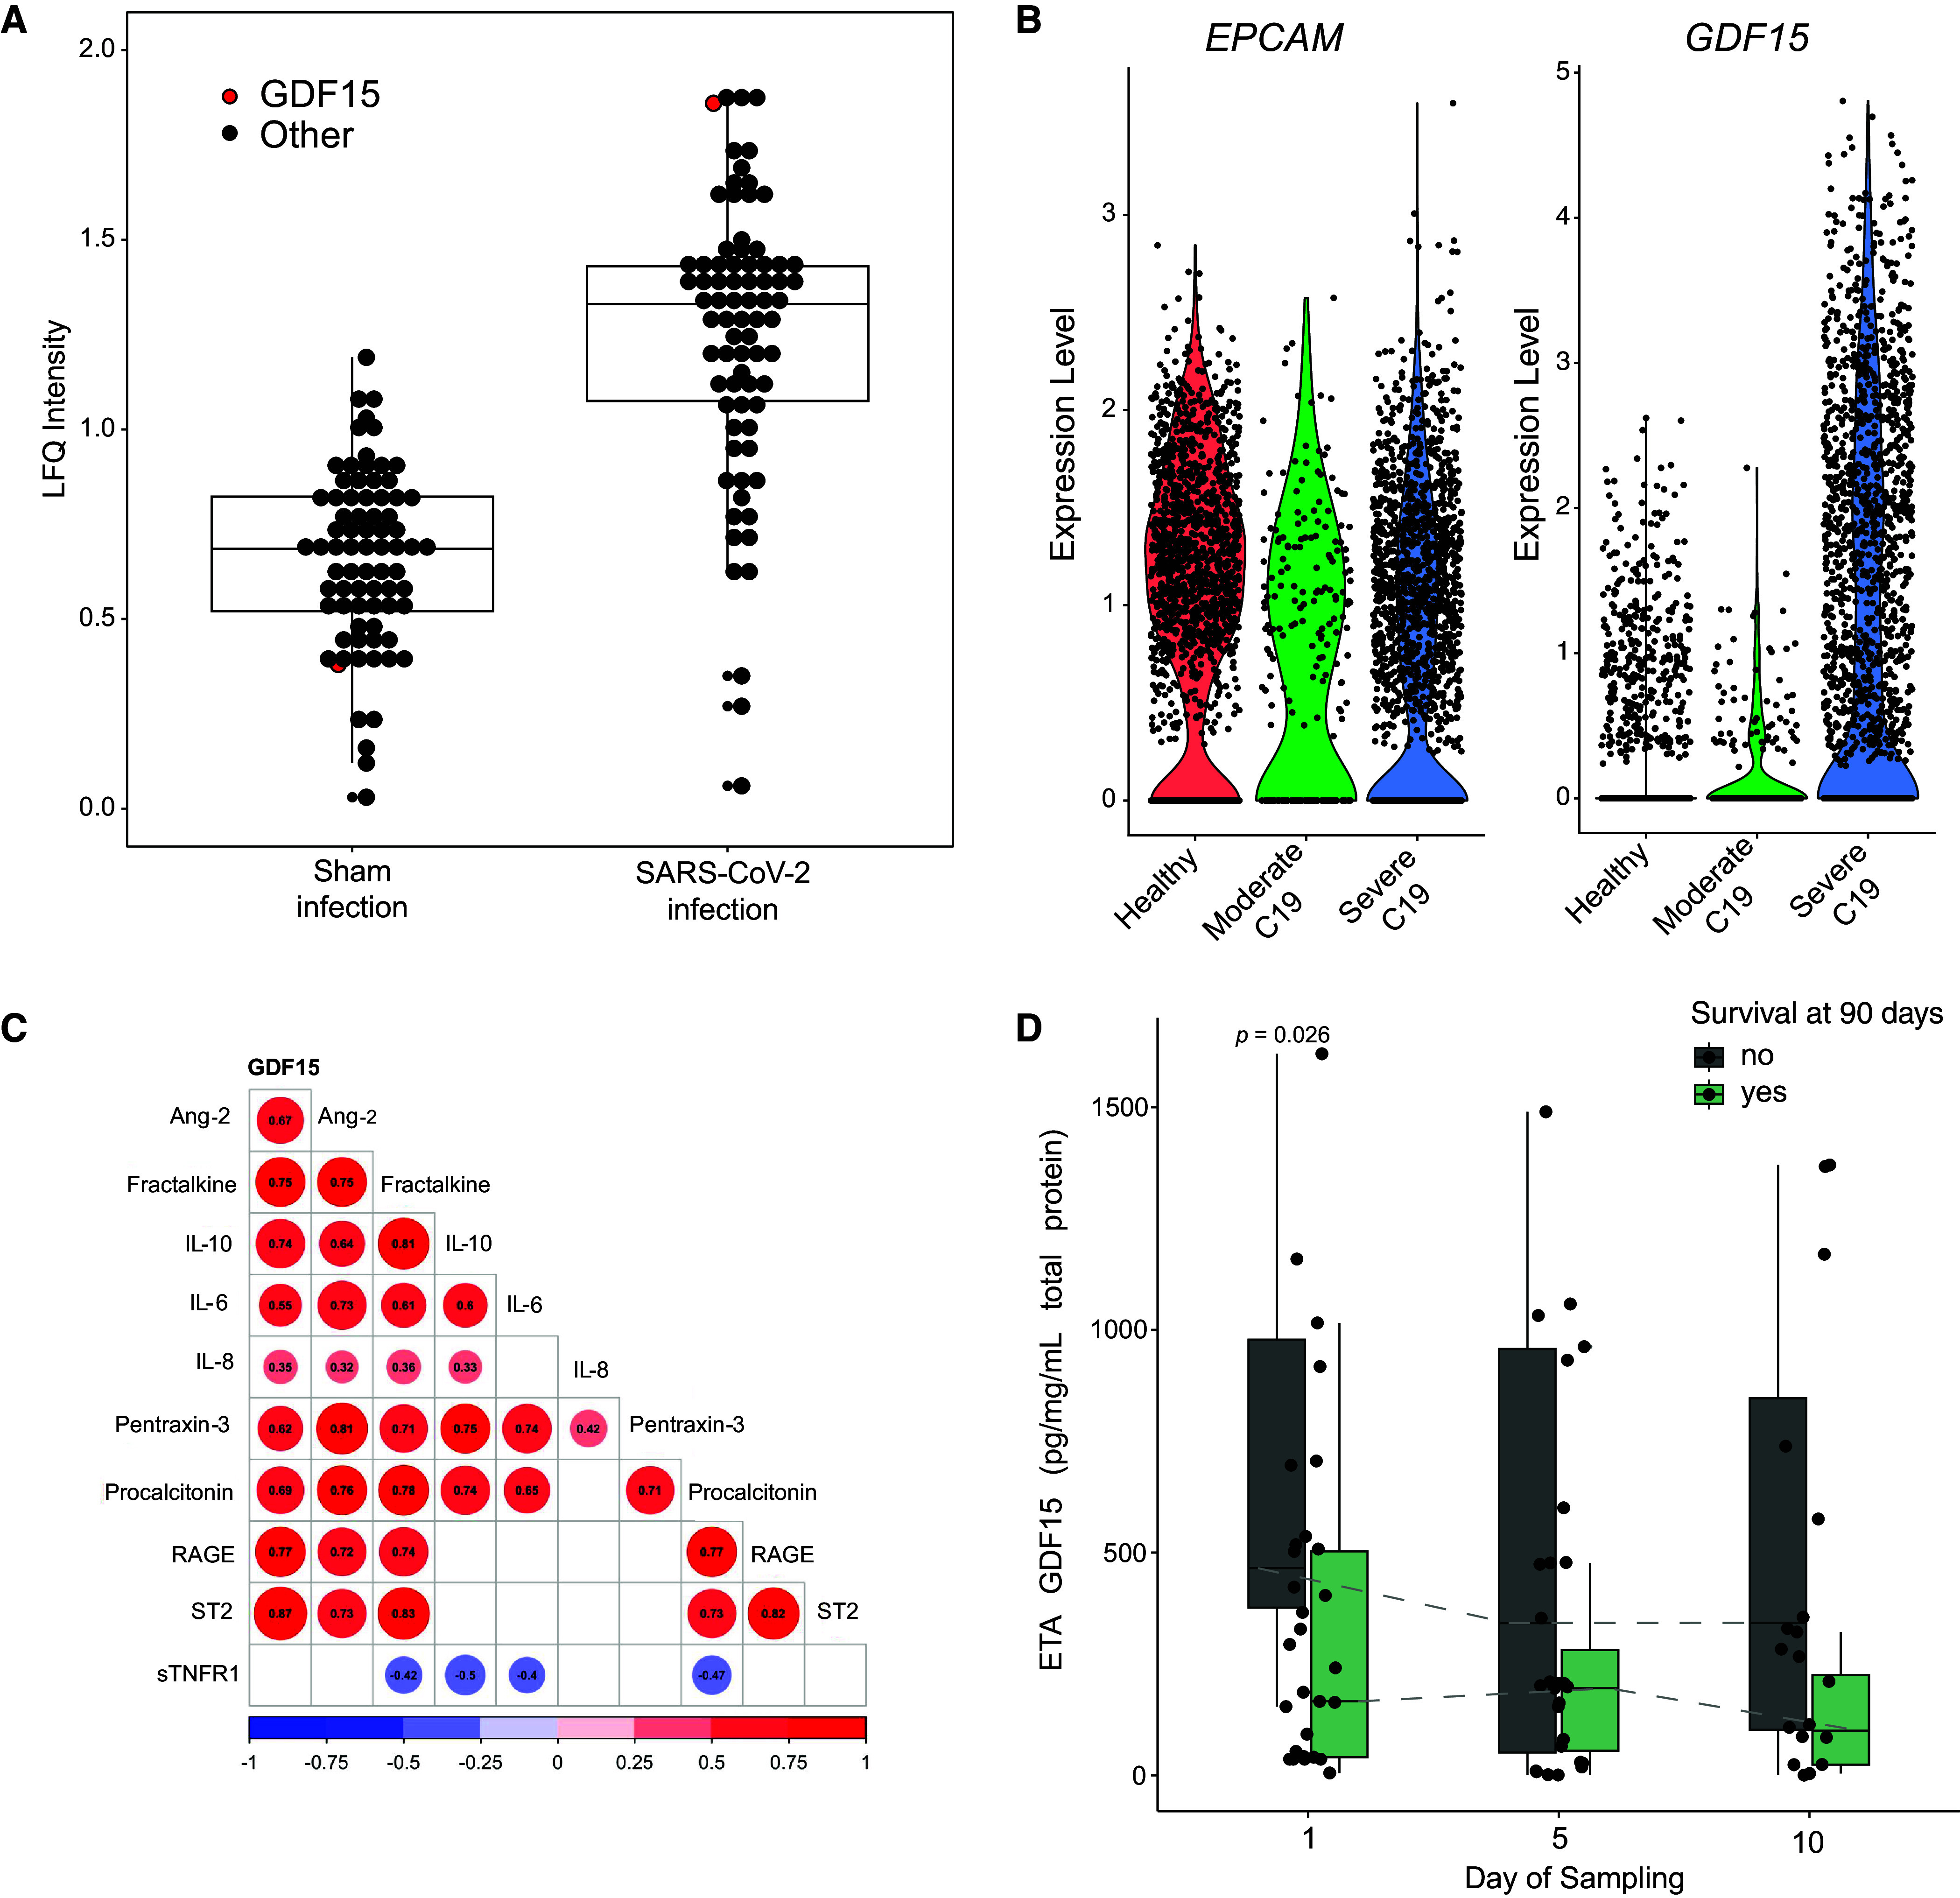
Human lung epithelium releases GDF15 in response to severe acute respiratory syndrome coronavirus 2 (SARS-CoV-2) infection. (A) Human lung alveolar epithelial cells infected with SARS-CoV-2 (n = 3) reveal increased levels of GDF15 by label-free quantification (LFQ) compared with control sham infection (n = 3) (30). Each point represents the median protein expression of upregulated proteins. GDF15 is red, whereas all other proteins are black. Box plot displays the median and IQR. (B) Publicly available single-cell RNA sequencing data from BAL fluid collected from patients infected with severe coronavirus disease (COVID-19) pneumonia (n = 6) or moderate COVID-19 pneumonia (n = 3) and healthy controls (n = 3; from Gene Expression Omnibus database accession GSE145926). Cells identified as lung epithelium by cluster analysis display significantly increased GDF15 RNA levels (P < 6.9 × 10−120 for severe COVID compared with healthy controls). (C) Correlogram of associations of ETA GDF15 levels (46 patients with 76 total time points on sampling Days 1, 5, and 10) with host inflammatory response biomarkers during COVID-19 pneumonia requiring mechanical ventilation. All ETA protein levels are normalized to total protein. The number in the circle displays the Spearman correlation. The direction and magnitude of correlation are displayed by color, nonsignificant correlations are blank, and P values are adjusted for multiple comparisons by Benjamini-Hochberg correction with significance set to P < 0.05. (D) Box-and-whisker plots showing ETA GDF15 levels stratified by sampling day (n = 29 on Day 1, n = 27 on Day 5, and n = 20 on Day 10; total n = 46) and comparing nonsurvivors (dark gray) and survivors (light green). Boxes represent the IQRs, horizontal lines represent the medians, and vertical lines extend from minimum to maximum values. Dashed lines connect the median values for each group at each sampling day to show longitudinal trends in GDF15 levels. Ang-2 = angiopoietin-2; ARFA = at risk for ARDS; C19 = coronavirus disease; LFQ = label-free quantification; Procal = procalcitonin; RAGE = soluble receptor for advanced glycation end-products; ST2 = suppression of tumorigenicity-2 (also known as IL-1 receptor ligand-1 or IL-33 receptor); sTNFR1 = soluble TNF receptor-1.