Figure 4.

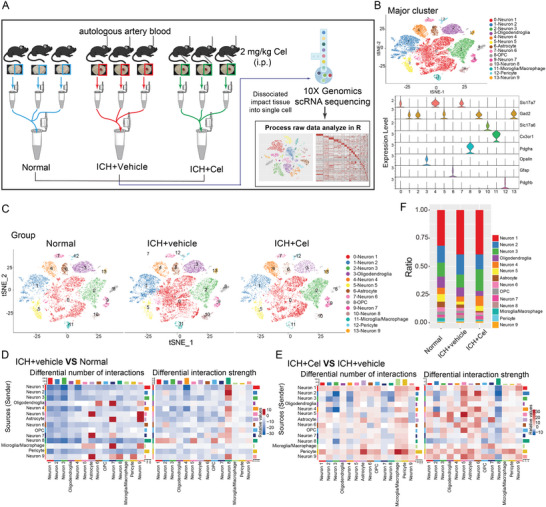
Single‐nucleus RNA sequencing was used to investigate the impact of celastrol on neuronal cells. After inducing ICH, mice were treated with 2 mg k−1g celastrol and brain tissue samples were collected 12 h post‐treatment. A) Schematic representation of single‐nucleus RNA sequencing. B) The t‐distributed stochastic neighbor embedding (t‐SNE) plot illustrates the major cell types in the mouse brain, while the violin plot shows the expression levels of specific markers within each cell type. C) The t‐SNE plot illustrates the clustering of single cells based on their cell types across different groups. D,E) The analysis of cell‐cell communication was conducted using CellChat, with a detailed heatmap displaying differential numbers and strengths of interactions. The bar plots colored on the top and right respectively represent the total values of columns (incoming signaling) and rows (outgoing signaling) displayed in the heatmap. The colorbar indicates that red (or blue) signifies an increase (or decrease) in signaling in the ICH+vehicle group compared to the Normal group(D); whereas it represents changes between ICH+Cel and ICH+vehicle groups (E). F) Variation in percentage change among different clusters within various groups.
