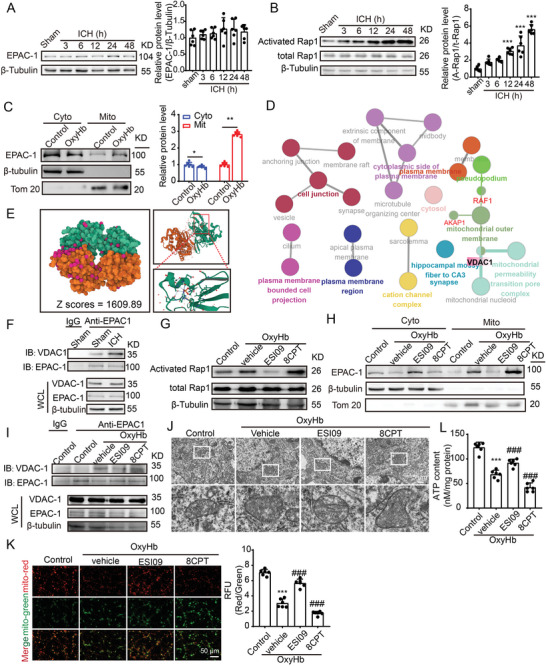
Figure 7.

EPAC‐1 contributes to mitochondrial dysfunction induced by ICH through its interaction with VDAC1. A) Samples of cortex surrounding the hematoma in mice were collected at 3, 6, 12, 24, and 48 h post‐ICH induction. The protein levels of EPAC‐1 were assessed via western blot analysis, and the alterations in expression were quantified. β‐Tubulin served as loading controls, with a sham group being normalized to a value of 1.0 for accurate comparisons (n = 6). B) EPAC‐1 activation was assessed by measuring the levels of activated Rap1‐GTP using a Rap1 Activation Assay Kit. β‐Tubulin served as loading controls, with each sham group being normalized to a value of 1 for accurate comparisons n = 6. C) Neurons underwent a 12 h stimulation with 10 µm OxyHb. Subsequently, mitochondria and cytoplasm were isolated, and the protein levels of EPAC‐1 in both compartments were evaluated using western blot analysis. β‐Tubulin and Tom20 served as loading controls, with each control group being normalized to a value of 1 for accurate comparisons, n = 6. D) Protein‐protein interaction (PPI) network was queried from the STRING database (https://string‐db.org), followed by functional protein enrichment analysis conducted through Cytoscape and ClueGO. E) Rigid protein‐protein docking (ZDOCK) was conducted to investigate the relationship between EPAC‐1 and VDAC1. The PDB format of the protein structural domain was obtained from the Protein Data Bank (PDB) at http://www.rcsb.org/. The ZDOCK module was used to identify docking sites and calculate ZDOCK scores. F) Cortex samples surrounding the hematoma in mice were collected from sham and ICH 24 h groups, followed by co‐immunoprecipitation to validate the interaction between EPAC‐1 and VDAC‐1. G,H) Following stimulation with 10 µm OxyHb for 12 h, neurons were treated with the EPAC‐1 inhibitor ESI09 (10 µm) or activator 8CPT (10 µm) for 24 h. The levels of activated Rap1‐GTP were detected using a Rap1 Activation Assay Kit (G), while EPAC‐1 protein levels in both compartments were assessed via western blot analysis (H). Co‐immunoprecipitation was used to detect the interaction between EPAC‐1 and VDAC‐1 I), and mitochondrial structures were examined by means of transmission electron microscopy with a scale bar of 5 µm J). The ATP content was quantified L), and mitochondrial membrane potential (MMP) was measured by JC‐1 staining K). All data are presented as mean ± SD. Statistical significance was determined using one‐ or two‐way ANOVA with Tukey's multiple comparisons tests (n = 6, *** p < 0.0001 vs control/ sham group; ### p < 0.0001 vs Vehicle group).
