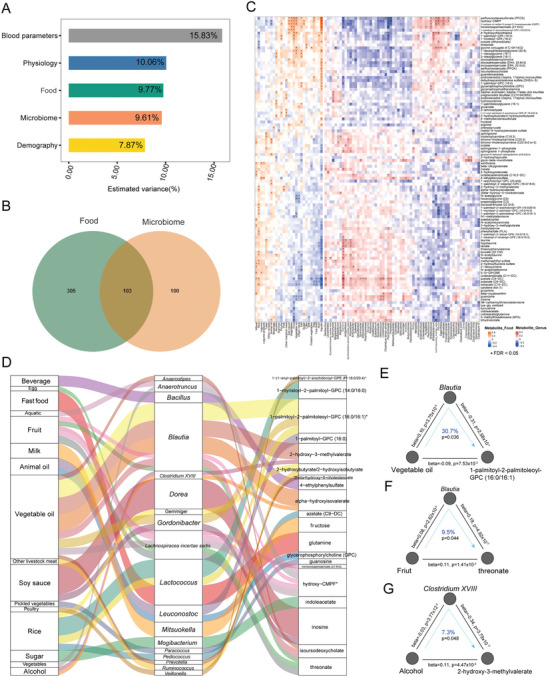
Figure 4.

Influence of the microbiome and diet on inter‐individual variation of serum metabolome. A) Contributions of indicated factors to inter‐individual variation in the serum metabolome estimated by the Adonis method (FDR < 0.05). B) Venn diagram indicating the number of metabolites significantly associated with specific foods and gut microbiota genera, as estimated using Spearman's correlation (FDR < 0.05). C) Association of serum metabolites and foods or microbiota genera in HN and GZ province (n = 496, FDR < 0.05). D) Mediation links between food, gut microbiota, and serum metabolites showed by parallel coordinates chart that are significant at FDR < 0.05. Shown are foods (left), gut microbiota (middle), and serum metabolites (right). The curved lines connecting the panels indicate the mediation effects. E) Analysis of the effect of vegetable oil intake on the levels of 1‐palmitoyl‐2‐palmitoleoyl‐GPC (16:0/16:1) as mediated by Blautia. F) Analysis of the effect of fruit intake on the levels of threonate as mediated by Blautia. G) Analysis of the effect of wine intake on the levels of 2‐hydroxy‐3‐methylvalerate through Clostridium XVIII. In (E–G), the gray lines indicate the associations. The blue arrowed lines indicate the food effects on serum metabolites mediated by specific genera. The beta coefficient and p values are labeled at each edge. The proportions of indirect effect (mediation effect) and mediation p values are labeled at the center of the ring charts.
