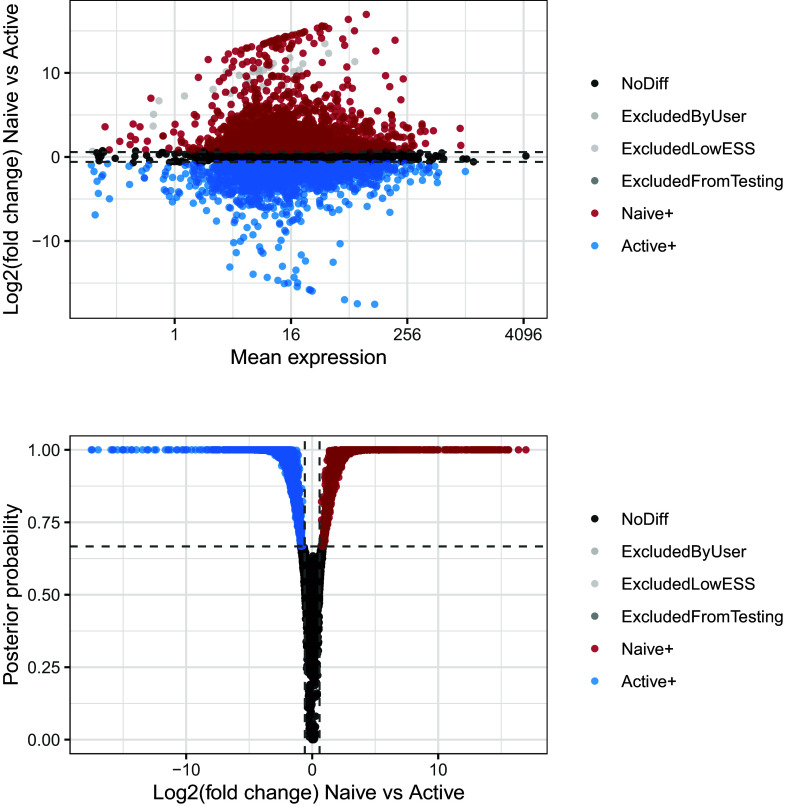
Figure 11. Upper panel presents the mean-difference plot associated to the differential mean expression test between naive and active cells.
Log-fold changes of average expression in naive cells relative to active cells are plotted against average expression estimates combined across both groups of cells. Bottom panel presents the volcano plot associated to the same test. Log-fold changes of average expression in naive cells relative to active cells are plotted against their associated tail posterior probabilities. Colour indicates the differential expression status for each gene, including a label to identify genes that were excluded from differential expression test due to low effective sample size.

