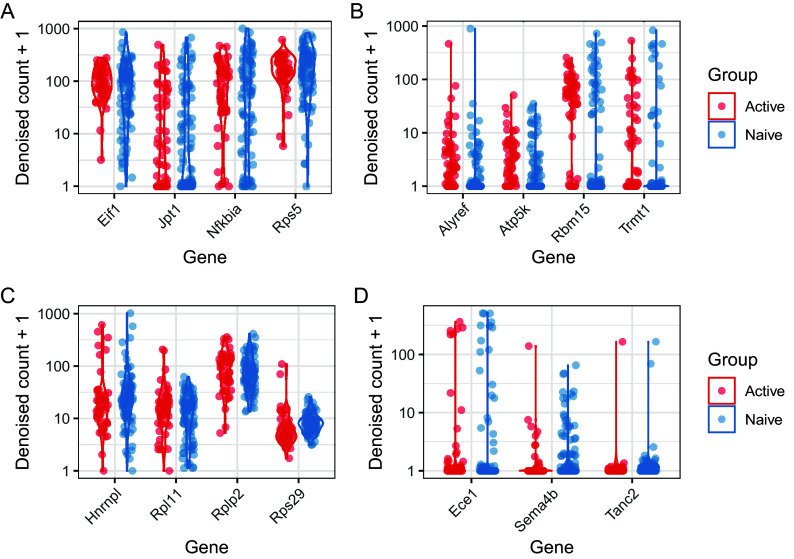
Figure 16. Violin plots of denoised counts.
A: Four genes with higher residual over-dispersion in naive cells, and similar levels of detection in active and naive populations. B: Four genes with higher residual over-dispersion in naive cells and different levels of detection in naive and active cells. C: Four genes with higher residual over-dispersion in active cells and similar levels of detection in naive and active cells. D: Three genes with higher residual over-dispersion in active cells and different levels of detection in naive and active cells.

