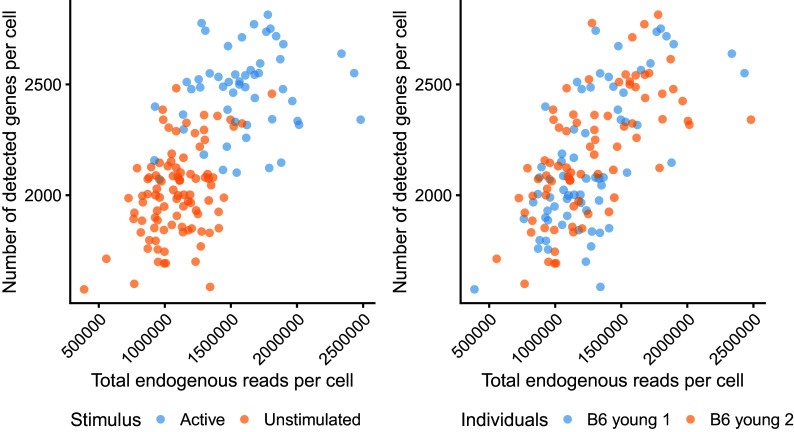
Figure 3. Cell-level quality control metrics according to cell-level metadata.
The total number of endogenous reads (excludes non-mapped and intronic reads) is plotted against the total number of detected genes. Colour indicates the experimental condition (left) and animal of origin (right) for each cell.

