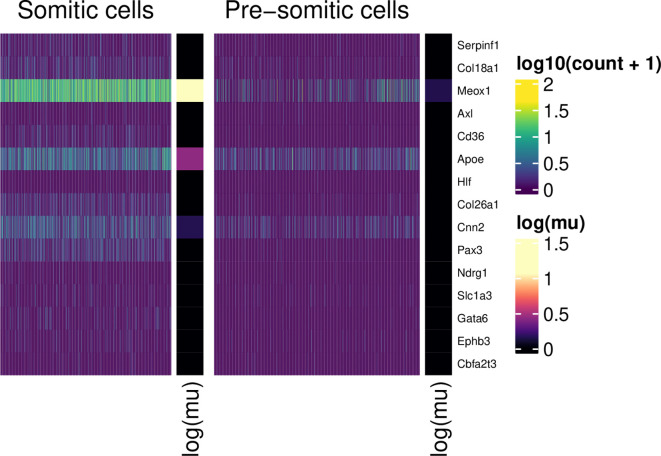
Figure 11. Normalised expression values (scale) for somitic and pre-somitic cells, showing genes up-regulated in SM cells.
For each group, 10 example genes are shown. These were selected according to the ranking of their associated tail posterior probabilities associated to the differential mean expression test. Colour indicates expression level; colour bars on the right of heatmap segments indicate the inferred mean expression level (in log scale) for each gene in each population.

