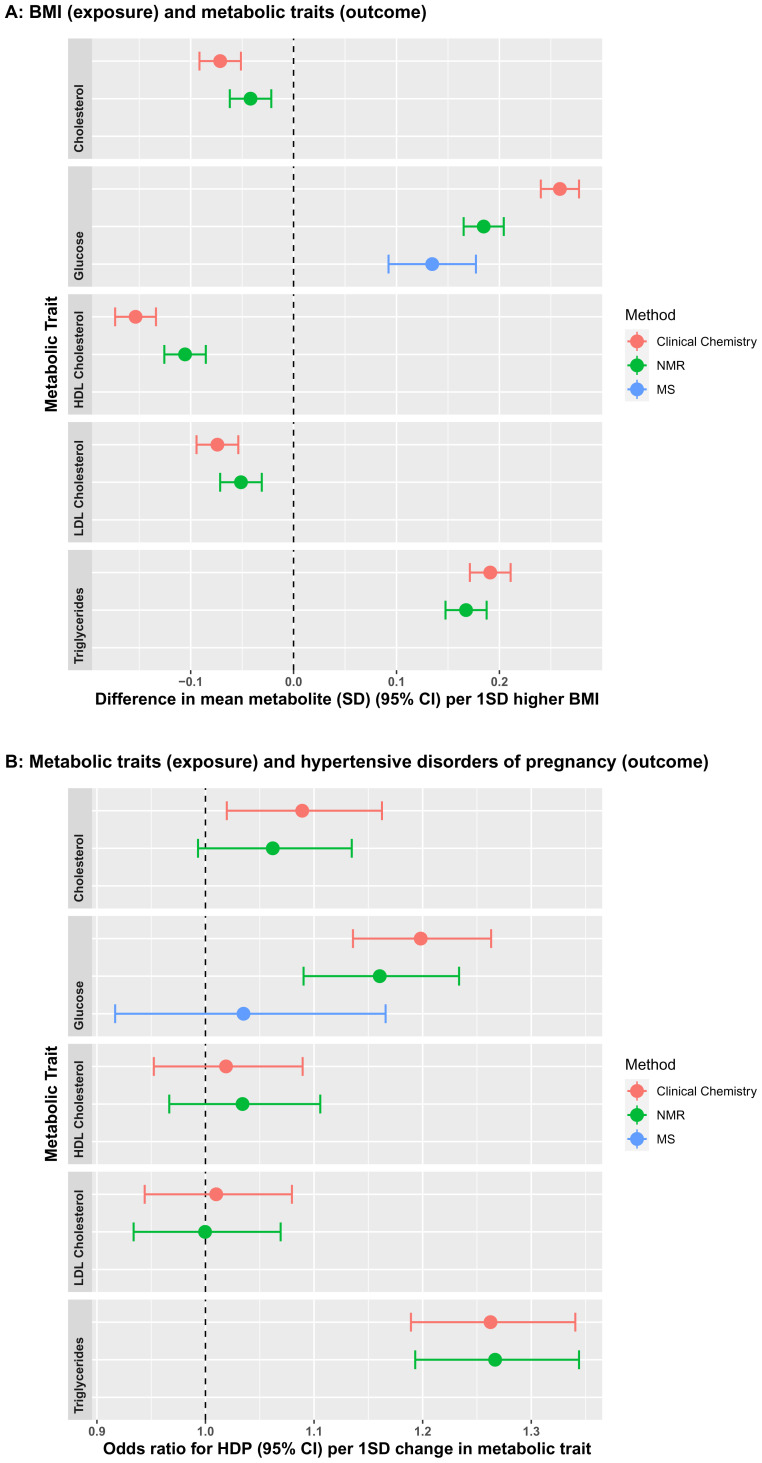
Figure 3.
Comparisons of the associations of early pregnancy body mass index (BMI) with fasting glucose and lipids measured by routine clinical chemistry assays, Nightingale Health© nuclear magnetic resonance (NMR) and mass spectrometry (MS, glucose only) ( 3A), fasting glucose and lipids measured by routine clinical chemistry assays, Nightingale Health© NMR and MS (glucose only) with hypertensive disorder of pregnancy (HDP) ( 3B). Associations in 3A are from unadjusted linear regression and data points show standard deviation differences in mean metabolite per one standard deviation (1SD) higher BMI. Associations in 3B are from unadjusted logistic regression and data points show unadjusted odds ratios for HDP per 1SD higher in metabolic trait. Error bars = 95% confidence intervals.

