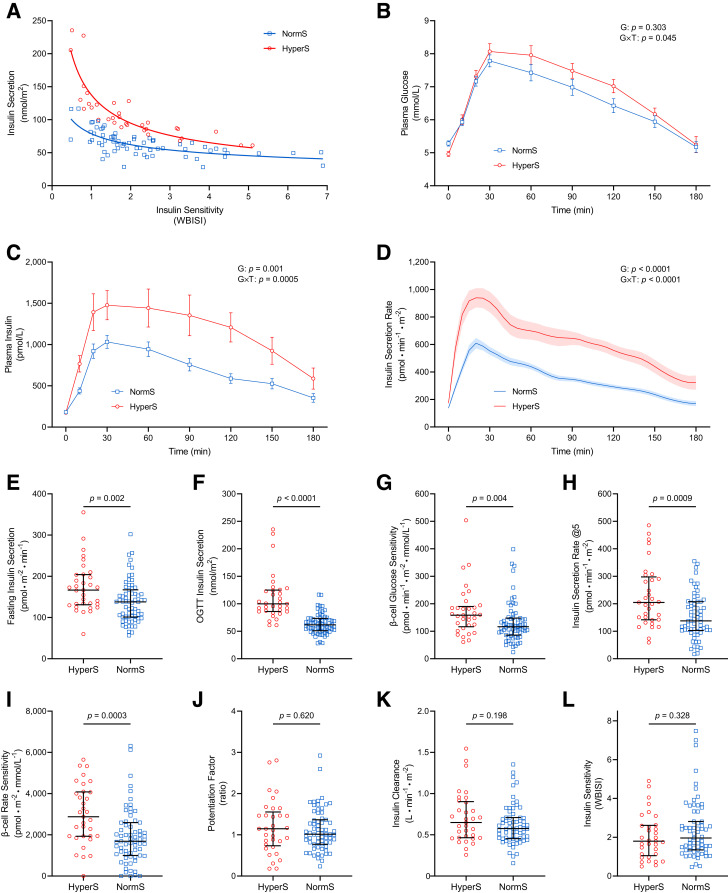
Figure 1.
Glucose homeostatic mechanisms in participants with HyperS or NormS. A: Identification of participants with HyperS and NormS as the upper and middle-lower tertiles of the residuals’ distribution of the OGTT-derived insulin secretion/WBISI best-fit line. B–D: Plasma glucose, insulin, and C-peptide–derived ISR profiles during the OGTT. E and F: Fasting and total insulin secretion. G–J: Model-derived β-cell glucose sensitivity, ISR@5, β-cell rate sensitivity, and potentiation factor ratio. K and L: Insulin clearance and WBISI. In B–D, data are mean ± SEM, and the group (G) and group-by-time interaction (G × T) effects were tested by two-way repeated-measures ANOVA. In E–L, lines represent median (IQR), and group differences were tested by Mann-Whitney U test.

