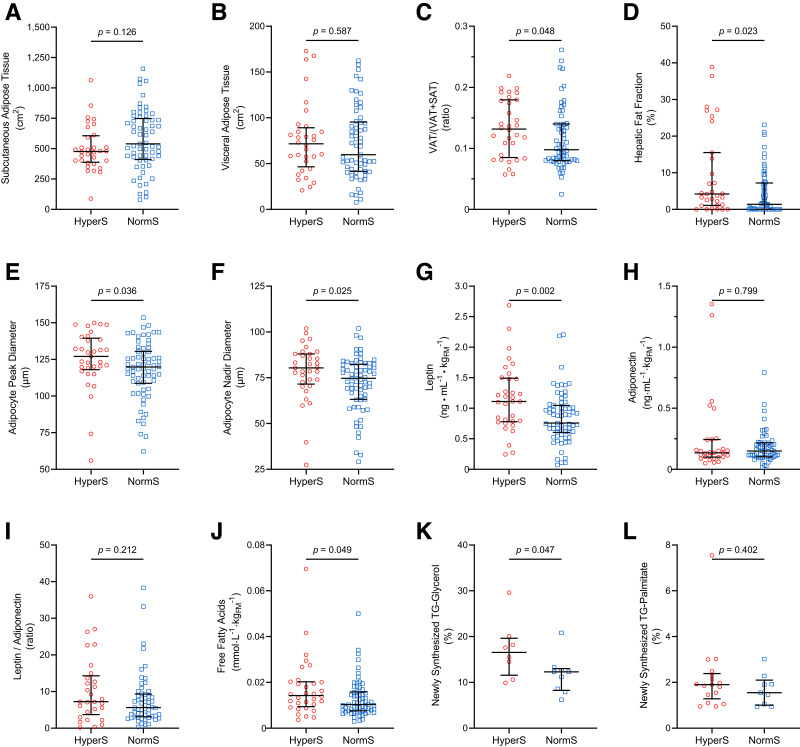
Figure 2.
Adipose tissue distribution, morphology, and function in participants with HyperS or NormS. A–D: SAT, VAT, VAT proportion (VAT / [VAT + SAT]), and HFF by abdominal MRI. E and F: Peak diameter and nadir diameter of the large adipocyte population by curve-fitting analysis of SAT biopsies. G–I: Plasma leptin, adiponectin, and leptin-to-adiponectin ratio normalized by FM. J: Plasma FFAs normalized by FM. K and L: Newly synthesized TG-glycerol and TG-palmitate by 2H2O labeling. Lines represent median (IQR). Group differences were tested using Mann-Whitney U test.

