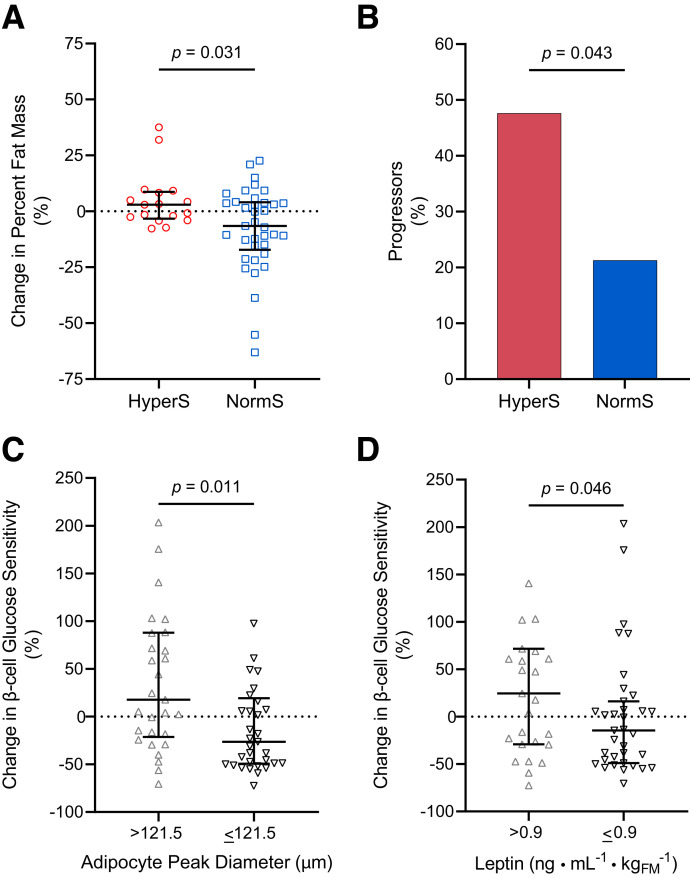
Figure 3.
Longitudinal changes in FM, glucose tolerance, and β-cell function. A and B: Percent change in FM% and progression from NGT to IFG/IGT or persistence in the IFG/IGT phenotype of participants with HyperS or NormS. C: Percent change in model-derived β-cell glucose sensitivity in participants with adipocyte peak diameter above (>121.5 μm) or below (≤121.5 μm) the median. D: Percent change in model-derived β-cell glucose sensitivity in participants with plasma leptin levels above (>0.9 ng ⋅ mL−1 ⋅ kgFM−1) or below (≤0.9 ng ⋅ mL−1 ⋅ kgFM−1) the median. In A, C, and D, the lines represent the median (IQR), and group differences were tested using Mann-Whitney U test. In B, group differences were tested using Fisher exact test.

