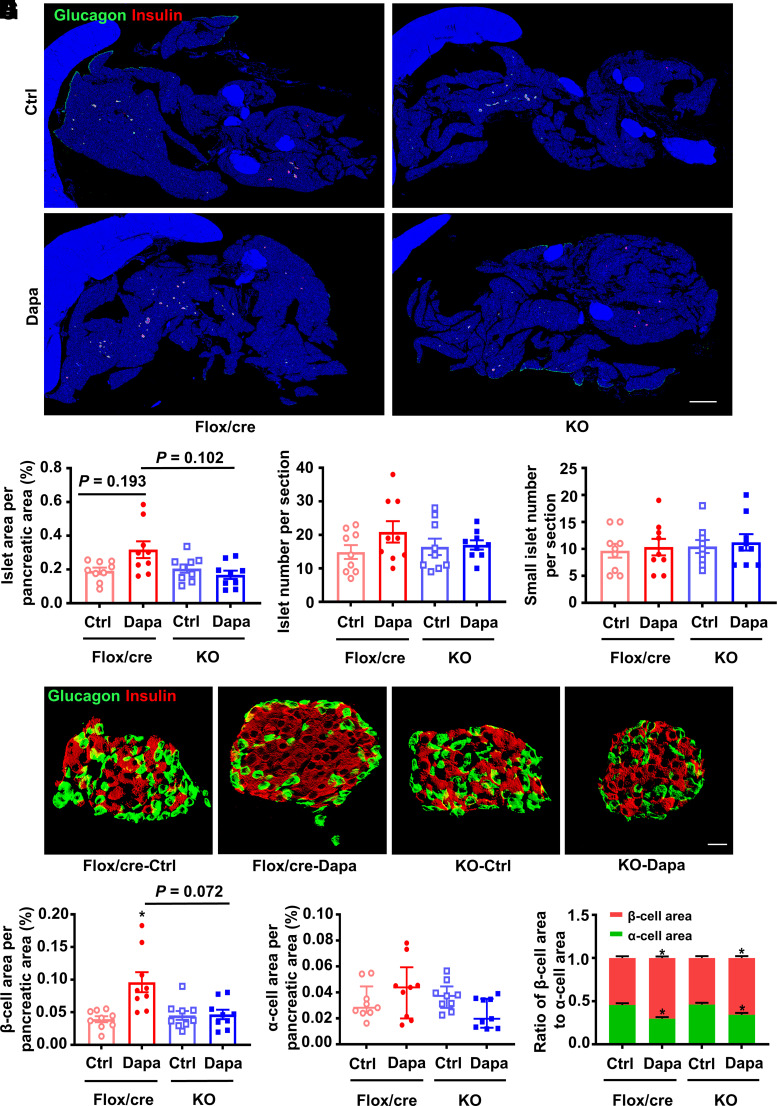
Figure 7.
Histological analysis in the pancreatic tissues of diabetic Glp1rpan−/− (KO) mice and Flox/Cre littermates treated with dapagliflozin (Dapa) or vehicle control (Ctrl) for 6 weeks. Diabetes was induced by high-fat diet and streptozotocin before the treatment. A: Representative photographs of the entire pancreata immunostained for glucagon and insulin. Scale bar = 2,000 μm. B: Quantification of the islet area per pancreatic area. C: Quantification of the islet number per section. D: Quantification of the small islet number per section. An islet with a cell number less than eight is defined as a small islet. E: Representative photographs of an islet immunostained for glucagon and insulin. Scale bar = 20 μm. F: Quantification of the β-cell area per pancreatic area. G: Quantification of the α-cell area per pancreatic area. H: The ratio of β-cell area to α-cell area. n = 3 sections/mouse and 3 mice/group. Data are mean ± SEM or median (interquartile range). Statistical analysis was performed by one-way ANOVA or two-way ANOVA followed by Tukey multiple comparisons test as appropriate in C, D, and H, one-way ANOVA followed by Dunnett T3 multiple comparisons test in B and F, or Kruskal-Wallis test followed by Dunn multiple comparisons test in G. *P < 0.05 (vs. Ctrl in the same genotype).

