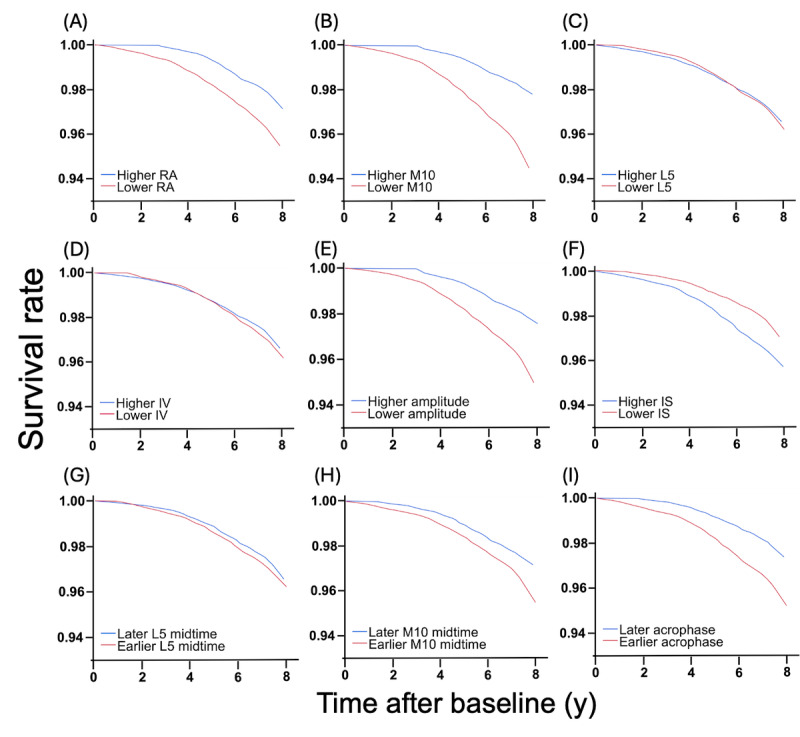
Figure 1.

Rest-activity rhythm and risk of developing dementia or MCI. Survival curves for dementia or MCI since baseline (actigraphy assessment) for (A) participants with lower RA (1st quartile) and higher RA (4th quartile), (B) participants with lower M10 (1st quartile) and higher M10 (4th quartile), (C) participants with lower L5 (1st quartile) and higher L5 (4th quartile), (D) participants with lower IV (1st quartile) and higher IV (4th quartile), (E) participants with lower amplitude (1st quartile) and higher amplitude (4th quartile), (F) participants with lower IS (1st quartile) and higher IS (4th quartile), (G) participants with earlier L5 midpoint (1st tertile) and later L5 midpoint (3rd tertile), (H) participants with earlier M10 midpoint (1st tertile) and later M10 midpoint (3rd tertile), and (I) participants with earlier acrophase (1st tertile) and later acrophase (3rd tertile). IS: interdaily stability; IV: intradaily variability; L5: activity level of the least active 5-hour period; M10: activity level of the most active 10-hour period; MCI: mild cognitive impairment; RA: relative amplitude.
