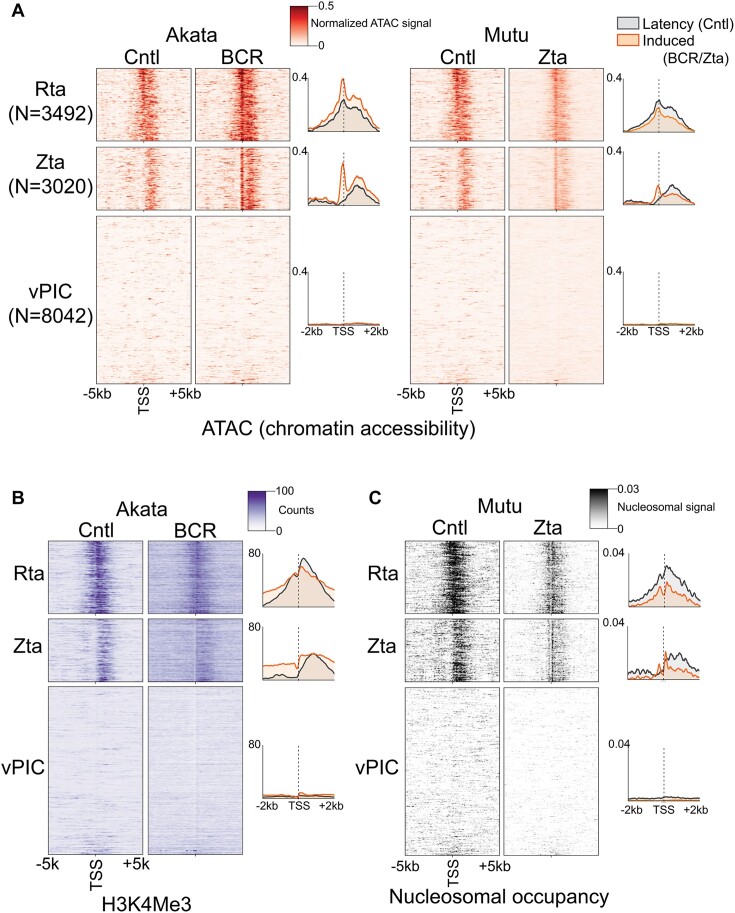
Figure 5.
Zta and Rta (and ‘unclassified’, see Supplemental Figure S5) subclasses of de novo promoters are positioned upstream from chromatin features characteristic of active promoters. (A) Chromatin accessibility (alignment coverage from ATAC-seq data) is plotted for positions from −5 kb to +5 kb from the respective de novo promoter start sites in both latent (‘Cntl’) and reactivation conditions in the Akata-BCR and Mutu-Zta reactivation models. Heatmap color intensities represent processed coverage values (via TOBIAS ATACorrect (19); positional coverages were corrected for sequence bias and normalized using the ratio of reads in called peaks to total reads). (B) H3K4me3 histone mark coverage (from ChIP-seq data) is plotted for positions from −5 kb to +5 kb from the respective de novo promoter start sites in latent (‘Cntl’) and reactivation conditions in the Akata-BCR reactivation model. (C) Positioned nucleosomes (signal obtained using NucleoATAC analysis of ATAC-seq data) is plotted for positions from −5 kb to +5 kb from the respective de novo promoter start sites in both latent (‘Cntl’) and reactivation conditions in the Mutu-Zta reactivation model. The y-axis for each panel is sorted in ascending order according to the sum of all de novo CAGE-Seq counts across both Mutu and Akata cells. The order is identical in panels A to C.

