Figure 6.
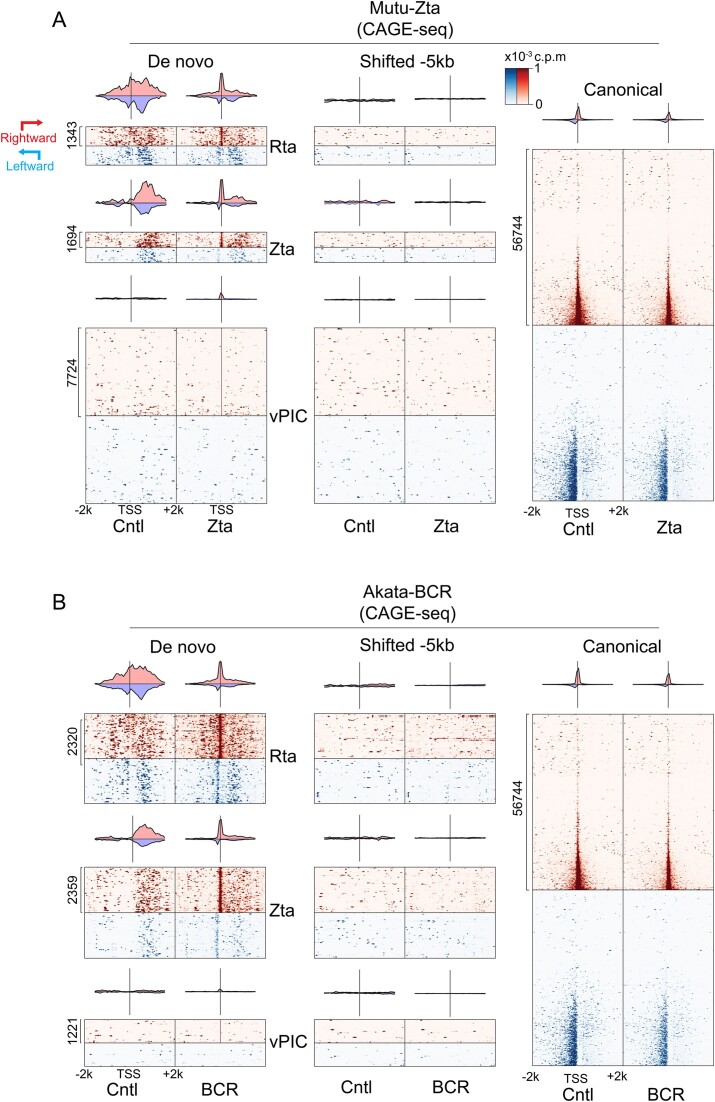
Zta and Rta (and ‘unclassified’, see Supplemental Figure S6) subclasses of de novo promoters are positioned upstream from active promoters. Transcription start site coverage (from CAGE-seq data) is plotted for positions from −2 kb to +2 kb from the respective de novo promoter start sites in both latent (‘Cntl’) and reactivation conditions in the Mutu-Zta (A) and Akata-BCR (B) reactivation models. Start site coverage in the same direction as each de novo promoter is plotted in red while start site coverage on the opposite strand is plotted on blue. As a control, start site coverage with respect to positions −5 kb from the de novo promoter start sites are shown in middle panels. In addition, start site coverage with respect to annotated canonical promoters is shown as a reference (right panels). Heatmaps only include de novo start sites detected in the cell line plotted (for example, only de novo TSSs detected in reactivated Mutu cells were plotted in Figure 6A, B). For each cell line, the y-axis is arranged in ascending order by the sum of all CAGE-Seq reads at the de novo TSS. The order is the same in Cntl and reactivation conditions for panels A and B.

