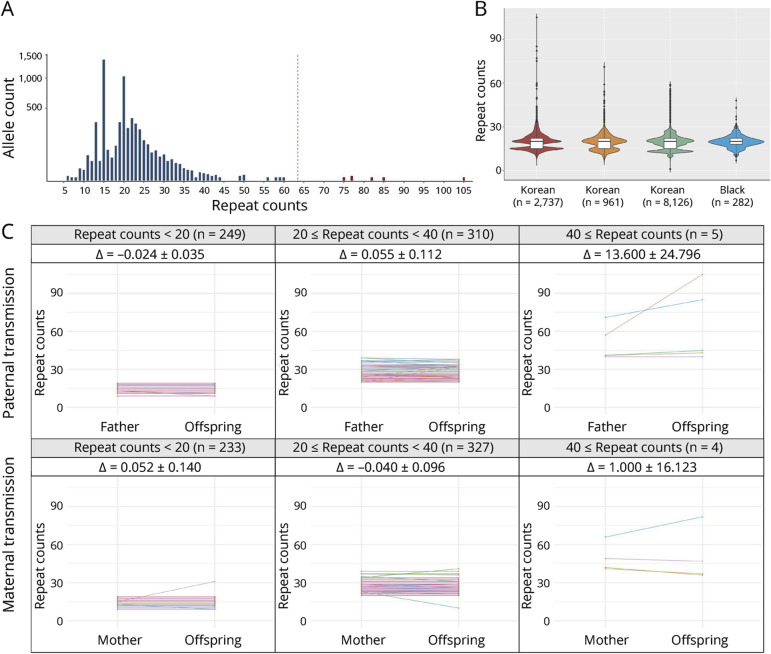
Figure 3. Exploring NOTCH2NLC GGC Repeat Expansions in the Korea Biobank Cohort.
(A) Distribution of the sizes of GGC repeats in 2,737 unrelated controls (5,446 alleles). The red dashed line represents the obtained cutoff value of 63.48. The 6 outliers are colored in red. The y-axis displays the allele count value on a square root transformed scale. (B) Size comparison of the GGC repeats among various ethnicities: 2,737 Korean, 961 Asian, 8,126 White, and 282 Black populations. (C) Clustering of STR transmission patterns within the NOTCH2NLC region, which has been categorized based on the number of STRs present in the parents. The magnitude of change (∆) within the interval is indicated by the 95% confidence interval.

